13726479
Multi-product CVP Analysis - Charts
- PV Charts show:
- The overall company breakeven point
- Which products should be expanded in output (the most profitable in terms of C/S ratio)
- Which products, if any, should be discontinued
- What effect changes in selling price and sales revenue would have on breakeven point and profit
- The average profit (the solid line which joins the two ends of the dotted line) earned from the sales of the
products in the mix
- The overall company breakeven point
- Charts
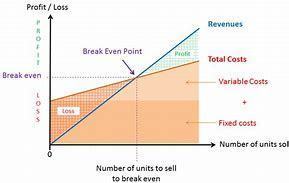
- Breakeven Charts
- Calculate total revenue and total costs for the mix of products
and plot on graph. Calculate the BEP using WACS Ratio
- Calculate total revenue and total costs for the mix of products
and plot on graph. Calculate the BEP using WACS Ratio
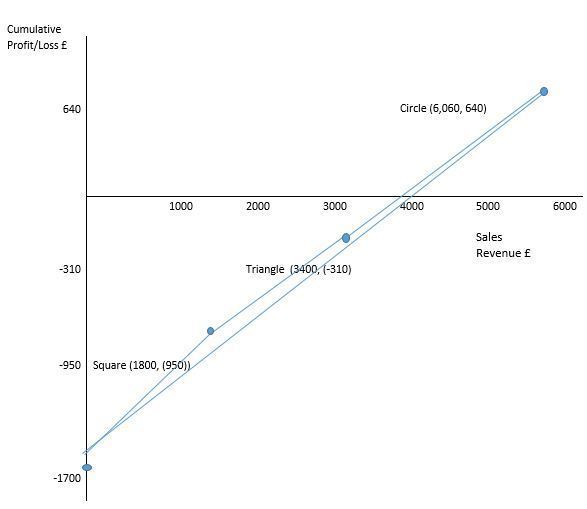
- PV Charts
- Plot the weighted average line by starting at the Fixed Costs
and cross the x axis at the breakeven point and ending at total
sales revenue
- Calculate cumulative revenues and cumulative profit and
plot in order of C/S ratio
- Calculate cumulative revenues and cumulative profit and
plot in order of C/S ratio
- Plot the weighted average line by starting at the Fixed Costs
and cross the x axis at the breakeven point and ending at total
sales revenue
- Breakeven Charts
Medienanhänge
Möchten Sie kostenlos Ihre eigenen Mindmaps mit GoConqr erstellen? Mehr erfahren.