304718
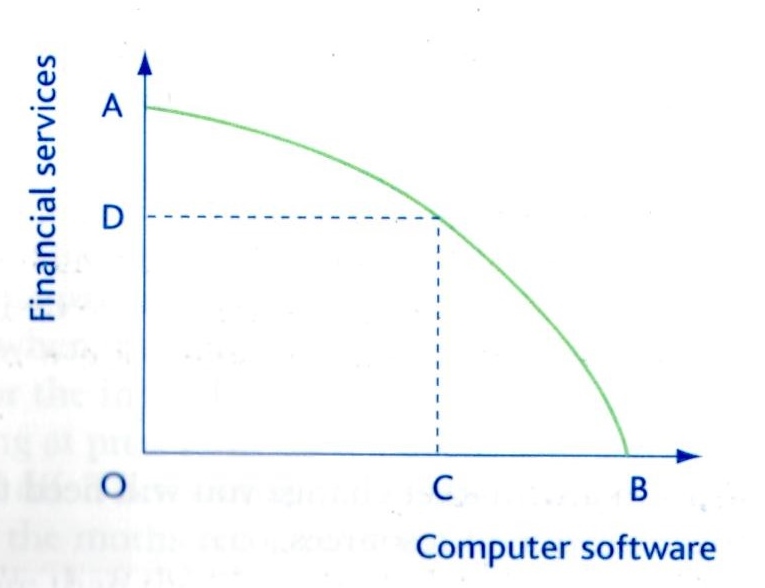
Production Possibility Diagrams
- aka Production Possibility Boundary (PPB)
- The PPB indicates the
MAXIMUM POSSIBLE OUTPUT
that can be achieved given a
fixed set of resources and
technology in a particular time
period
- The diagram
COMPARES TWO
POSSIBLE GOODS
OR SERVICES being
produced, e.g.
financial services and
computer software
- The curve indicates where
the maximum output is
being achieved (when all
the resources are being
fully utilised)
- The curve indicates where
the maximum output is
being achieved (when all
the resources are being
fully utilised)
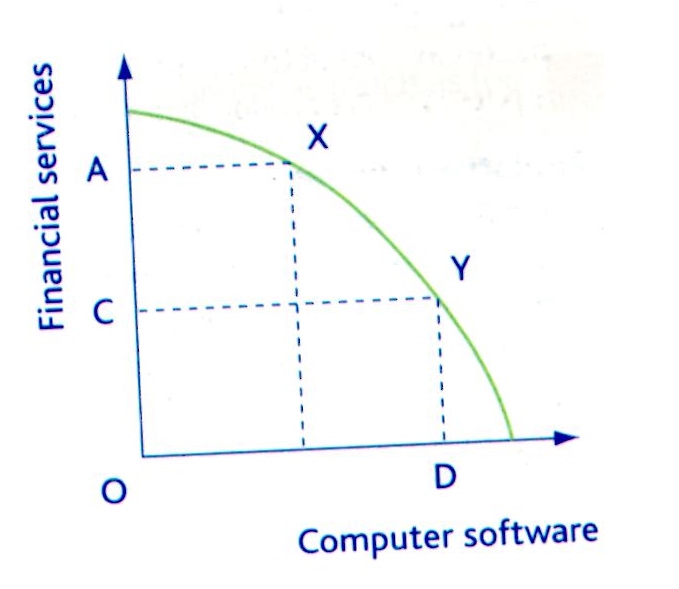
- Opportunity Cost
- The PPB can illustrate choice and OPPORTUNITY COST, If we are operating on the PPB then
to INCREASE OUTPUT for one product, we must REDUCE OUTPUT of another product
- Example: in order to produce more
financial services you must
produce less computer software
- e.g. to shift production from X to Y you would produce OD of computer software but must give up AC of financial services
- e.g. to shift production from X to Y you would produce OD of computer software but must give up AC of financial services
- Example: in order to produce more
financial services you must
produce less computer software
- OPPORTUNITY COST= the next best alternative foregone when an economic decision is made
- The PPB can illustrate choice and OPPORTUNITY COST, If we are operating on the PPB then
to INCREASE OUTPUT for one product, we must REDUCE OUTPUT of another product
- PRODUCTIVE EFFICIENCY= when a firm operates at minimum
average total cost, producing the maximum possible output from
inputs into the production process. This is at any point on the PPB, it
considers only the method which involves the least wastage of
resources, not the combination that maximises economic welfare.
- ALLOCATIVE EFFICIENCY= this is achieved in an economy when
it is not possible to make anyone better off without making
someone worse off, or you cannot produce more of one good
without making less of another. This is achieved at points on the
PPB.
- KEY POINTS...
- all points on the PPB are productively and allocatively efficient
- it is not possible to achieve output levels beyond the PPB
- points within the PPB are not using all the resources to full capacity
- so from points within the PPB it is possible
to increase output without an opportunity cost
- shifts between two points on a PPB will always carry an opportunity cost
- shifts between two points on a PPB will always carry an opportunity cost
- so from points within the PPB it is possible
to increase output without an opportunity cost
- points within the PPB are not using all the resources to full capacity
- it is not possible to achieve output levels beyond the PPB
- all points on the PPB are productively and allocatively efficient
Medienanhänge
Möchten Sie kostenlos Ihre eigenen Mindmaps mit GoConqr erstellen? Mehr erfahren.