Beschreibung
|
|
Erstellt von Georgia Freeman
vor fast 11 Jahre
|
|
Seite 1
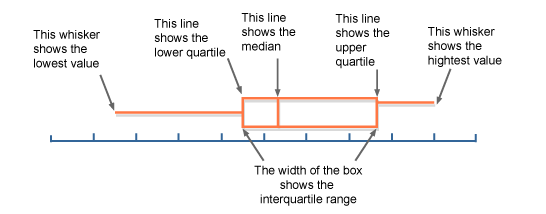
A box and whisker plot is used to display information about the range, the median and the quartiles. It is usually drawn alongside a number line, as shown:
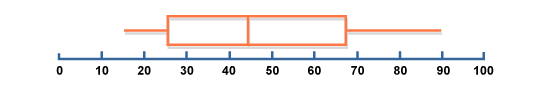
Example The oldest person in Mathsminster is 90. The youngest person is 15.The median age of the residents is 44, the lower quartile is 25, and the upper quartile is 67.Represent this information with a box-and-whisker plot. Solution
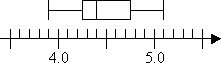
Since my list values have one decimal place and range from 3.9 to 5.1, I won't use a scale of, say, zero to ten, marked off by ones. Instead, I'll draw a number line from 3.5 to 5.5, and mark off by tenths. Now I'll mark off the minimum and maximum values, and Q1, Q2, and Q3: The "box" part of the plot goes from Q1 to Q3: And then the "whiskers" are drawn to the endpoints:
Look at this set of data: 1, 5, 7, 8, 9, 12, 13, 15, 17, 18, 35. The interquartile range is 17 - 7 = 10. The range is 35 - 1 = 34.
Look at this set of data: 1, 5, 7, 8, 9, 12, 13, 15, 17, 18, 35. The interquartile range is 17 - 7 = 10. The range is 35 - 1 = 34.
New Page
Möchten Sie kostenlos Ihre eigenen Notizen mit GoConqr erstellen? Mehr erfahren.