20 Questions 20 Answers Unit 1.3
Angeheftet an
16
0
0
Keine Merkmale angegeben

|
Erstellt von Assged Abdalla
vor fast 8 Jahre
|
|
Schließen

|
Erstellt von Assged Abdalla
vor fast 8 Jahre
|
|

Why are measurements and observations displayed in tables?
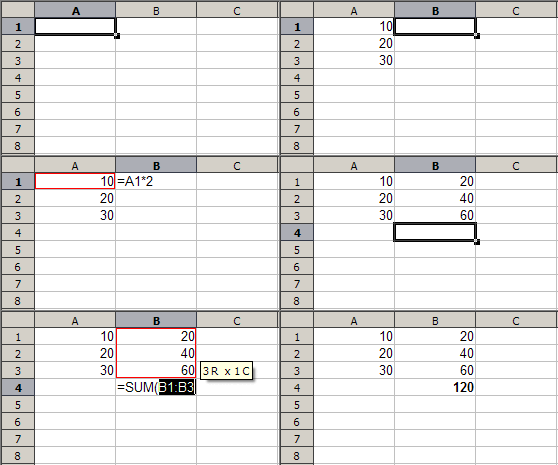
What can Spreadsheets be
programmed to do?
Define the word discrete from
discrete groupings?
Define the word continuous?
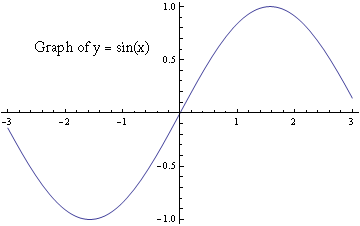
What are some examples of
continuous measurements?
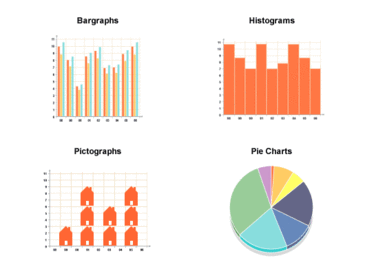
Discrete groupings can construct different types of graphs name them.
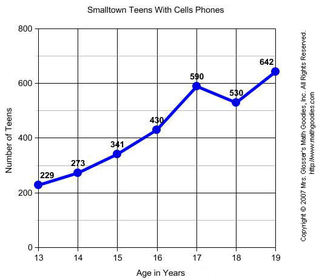
Line graphs require two sets of measurements that show continuous
variation. What are they?
What's the difference between line graphs and lines of best fit?
What do Scientists need to do during an
experiment to make it
useful?
How do tables and graphs help scientists
when they do their experiments?
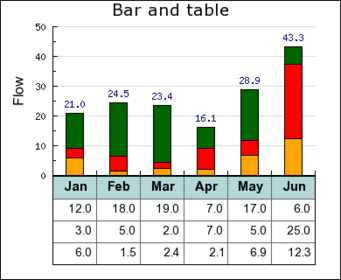
What types of graphs are
used when you have a set of
discrete observations?
What is shown in a pie
or sector graph?
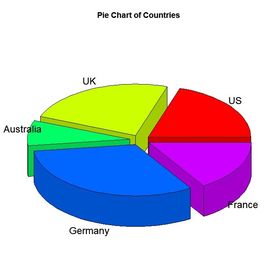
What are the different types
of line graphs?
What can a graph do that
table cannot?
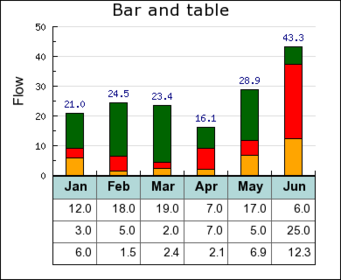
What makes an experiment
complete?
What computer program can enable
you produce a digital table or
a spreadsheet?
Apart from enabling computer programs what else can a spreadsheet do?
When discrete groups are categorized
are measurements possible
between each of the
categories?
Bar and column graphs have discrete values, but what is displayed from the graphs?
Once you have plotted all the points on a line graph there are two ways to connect the points. What are they?

 Verberge bekannte Karten