739182
Frage 1
Frage
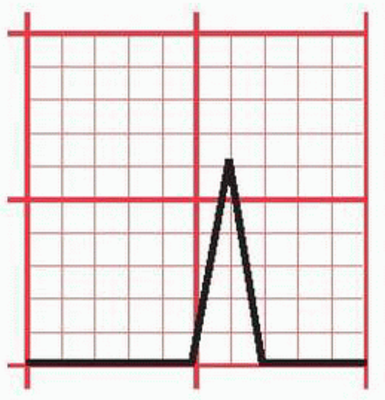
Here's some ECG paper. It's comprised of, in Dr Flynn's terms, "big squares" and "little squares". Each big square is 5x5 little squares. For one LITTLE square, select the correct size in mm, the correct voltage its height represents in mV of current, and the correct time period its width represents in seconds.
Image:
paper (image/png)
Antworten
-
1mm x 1mm
-
0.5 mm x 0.5 mm
-
1mV
-
10mV
-
0.04 seconds
-
0.2 seconds
Frage 2
Frage
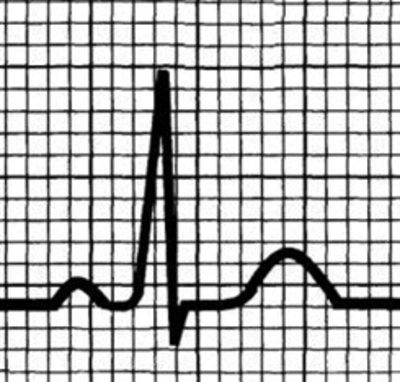
Here is a textbook-perfect segment of an ECG. What's the flat line, without any deflections, called?
Image:
paper (image/png)
Antworten
-
The iso-electric line
-
The baseline
-
The flatline
-
Holt's line
Frage 3
Antworten
-
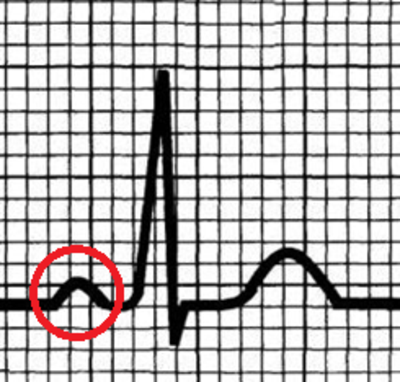
P wave
-
T wave
-
J wave
-
Q wave
Frage 4
Frage
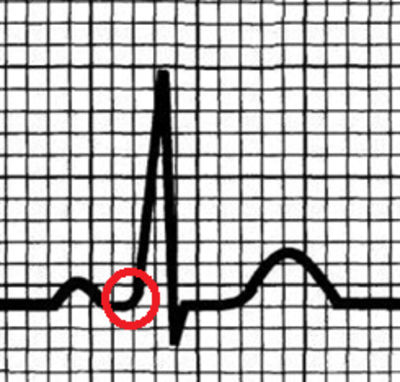
Sometimes there is a downward deflection at this point. What is it called?
Image:
q_wave (image/png)
Antworten
-
P wave
-
T wave
-
Q wave
-
J wave
Frage 5
Frage
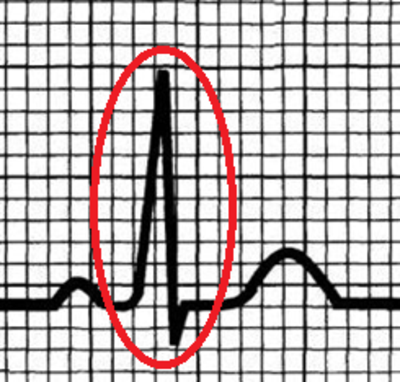
What is the combination called of a downward deflection, followed by an upward deflection, followed by another download inflection?
Image:
qrs_complex (image/png)
Antworten
-
ABC complex
-
QMT complex
-
JMP complex
-
QRS complex
Frage 6
Frage
In the six steps to interpreting ECGs, the first is to determine the rate. The heart rate is determined by the number of squares or mm between two R waves. What are the TWO easiest ways to determine the rate?
Antworten
-
1500/(# of little squares between r waves)
-
300/(# of big squares between r waves)
-
500/(# of big squares between r waves)
-
3000/(# of little squares between r waves)
Frage 7
Frage
What is the second step to interpreting the ECG?
Antworten
-
Determine the rhythm
-
Hand it to the cardiologist
-
Examine the p wave
-
Determine the heart axis
Frage 8
Frage
The third step is interpreting the p wave, which indicates depolarisation of the atria. When considering the p wave, first determine if it is present. If it is present, what should a normal p wave look like?
Antworten
-
2.5 mm x 2.5 mm
-
1mm x 1 mm
-
2.5 mm x 5 mm
-
Less than half the height of the QRS complex
Frage 9
Frage
The PR interval should be 3-5mm. What does it represent?
Antworten
-
Time taken for depolarisation to start at the AV node, travel through the atria and conducting system to the ventricular muscle
-
Time taken for depolarisation to start at the AV node, travel through the atria to the AV node
-
Time taken for depolarisation to start at the AV node, travel through the atria and conducting system to the Bundle of His
Frage 10
Frage
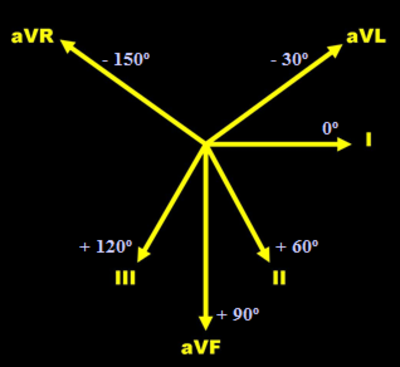
The fourth step is interpreting the QRS complex (representing depolarisation of the ventricles), which has several sub-steps. First, consider the cardiac axis. The wave of depolarisation spreads in multiple directions through the ventricles. The differing magnitudes and directions of the various depolarisation currents can be “summed” to form a resulting electrical vector, which is known as the cardiac axis.
If we consider the heart in the coronal plane (using the limb leads), an abnormal axis is outside -30 to +90 degrees. What are the steps to determining the cardiac axis?
Image:
limb_leads (image/png)
Antworten
-
Find the lead with the most biphasic QRS complex, determine the lead most perpendicular to it, and then determine whether the impulse is travelling towards (upwards deflection), or away from (downwards deflection) that lead. The resultant degree value is the cardiac axis.
-
Find the lead with the most biphasic QRS complex, and then determine whether the impulse is travelling towards (upwards deflection), or away from (downwards deflection) that lead. The resultant degree value is the cardiac axis.
-
Find the lead with the least biphasic QRS complex, determine the lead most perpendicular to it, and then determine whether the impulse is travelling towards (upwards deflection), or away from (downwards deflection) that lead. The resultant degree value is the cardiac axis.
Frage 11
Frage
What should q waves look like?
Antworten
-
Less than 1mm in width, less than 2mm in depth, and pointed
-
More than 1mm in width, more than 2mm in depth, and pointed
-
Less than 1mm in width, less than 2mm in depth, and curved
-
Less than 2mm in width, less than 2mm in depth, and pointed
Frage 12
Frage
Considering QRS complexes from from V1 to V6, two trends are apparent: the R-wave becomes progressively larger, and the S-wave becomes progressively smaller. This is called R wave progression. What is a lack of R wave progression usually an indication of?
Antworten
-
Right ventricular enlargement or an old anterior infarct
-
Left ventricular enlargement or an old anterior infarct
-
Septal enlargement or an old full-thickness infarct
-
Atrial enlargement
Frage 13
Frage
The QRS complex duration should be less than 2.5mm. When considering amplitude, we need to consider whether there is indication of left ventricular hypertrophy or right ventricular hypertrophy. Is the following criteria to determine LVH or RVH?
a. Sokolow-Lyon criteria:
S-wave in lead V1 + R-wave in either lead V5 or V6 > 35 mm.
b. Cornell criteria:
Males: S-wave in lead V3 + R-wave in lead aVL > 28 mm.
Females: S-wave in lead V3 + R-wave in lead aVL > 20 mm.
Antworten
-
Left VH
-
Right VH
Frage 14
Frage
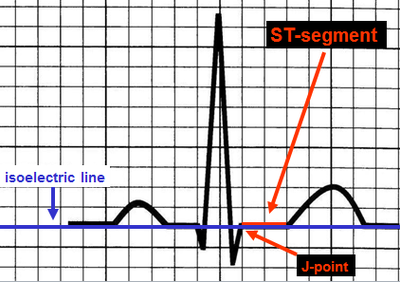
For the fifth step, consider the ST segment. ST segments can be elevated or depressed from the iso-electric line. The ST-segment is said to be depressed if it slopes down 1mm or more from the J-point, or is depressed 1mm or more horizontally. ST-segment elevation of up to 3 mm in the right-sided chest leads, and up to 1 mm in the limb leads may be normal, and is referred to as early repolarisation.
What conditions do these phenomena indicate?
Image:
ST_segment (image/png)
Antworten
-
ST-segment depression: subendocardial ischaemia, digoxin, “strain”; ST-segment elevation: full-thickness ischaemia, pericarditis
-
ST-segment depression: full-thickness ischaemia, pericarditis; ST-segment elevation: subendocardial ischaemia, digoxin, “strain”
Frage 15
Frage
For the sixth and final step, we need to consider the t wave. What should the amplitude of the t wave be?
Antworten
-
> 1/8 but < 2/3 the size of the preceding R-wave
-
Between 2 and 10 mm
-
< 1/2 the size of the preceding R-wave
-
Less than 8mm
Möchten Sie mit GoConqr kostenlos Ihre eigenen Quiz erstellen? eigenen Mehr erfahren.