14155333
Beschreibung
Karteikarten von María Marchante, aktualisiert more than 1 year ago
|
|
Erstellt von María Marchante
vor mehr als 6 Jahre
|
|
| Frage | Antworten |
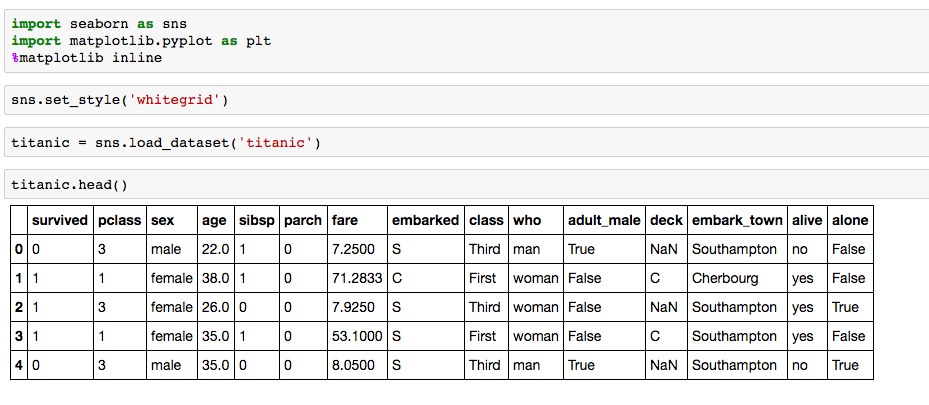
| The Data We will be working with a famous titanic data set for these exercises. Later on in the Machine Learning section of the course, we will revisit this data, and use it to predict survival rates of passengers. For now, we'll just focus on the visualization of the data with seaborn: https://github.com/mwaskom/seaborn https://seaborn.pydata.org/ | |
| Recreate the plots below using the titanic dataframe. There are very few hints since most of the plots can be done with just one or two lines of code and a hint would basically give away the solution. Keep careful attention to the x and y labels for hints. Note! In order to not lose the plot image, make sure you don't code in the cell that is directly above the plot, there is an extra cell above that one which won't overwrite that plot! | |
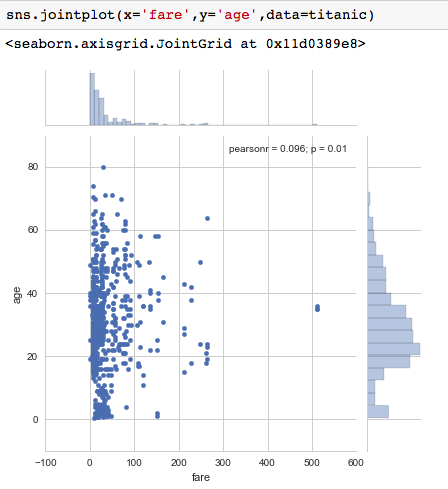
| joint plots | |
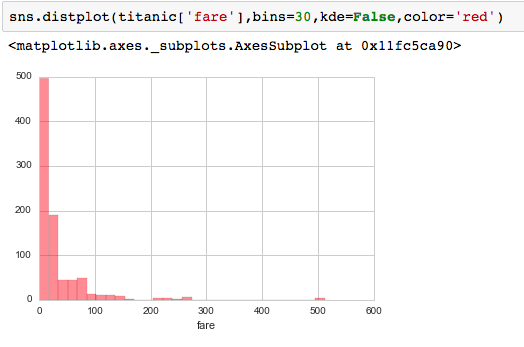
| distplot | |
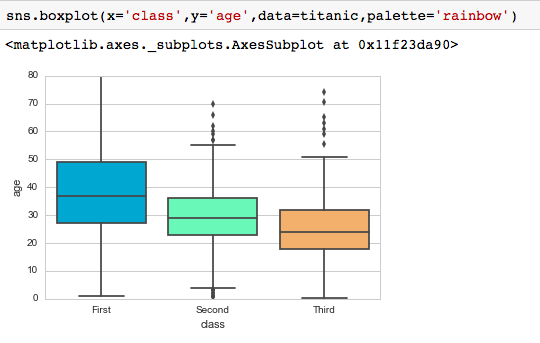
| boxplot | |
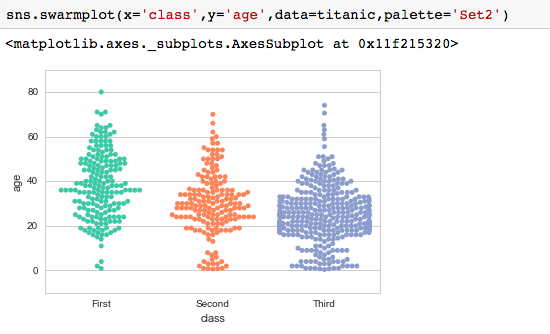
| swarmplot | |
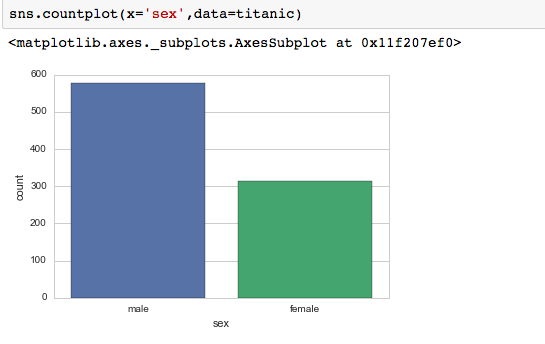
| countplot | |
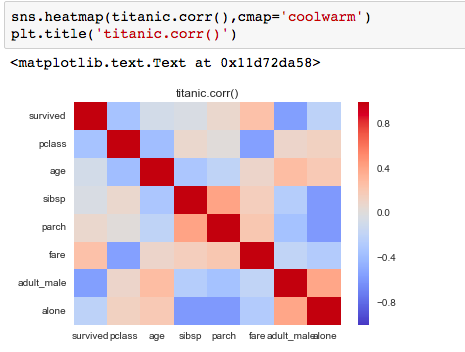
| heatmap ... rugplot pairplot | |
| FacetGrid |
Möchten Sie mit GoConqr kostenlos Ihre eigenen Karteikarten erstellen? Mehr erfahren.