
Categorical Data
Numerical Data
Uni-variate Data
Bi-variate Data
Multivariate Data
Relative Frequency Formula
Interquartile Range (IQR)
Describing Categorical Data
Name this graph and identify the type of data it's used for
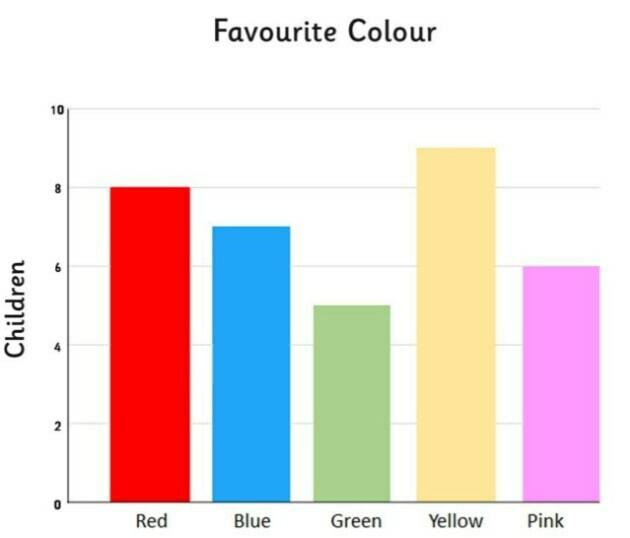
Name this graph and identify the type of data it's used for
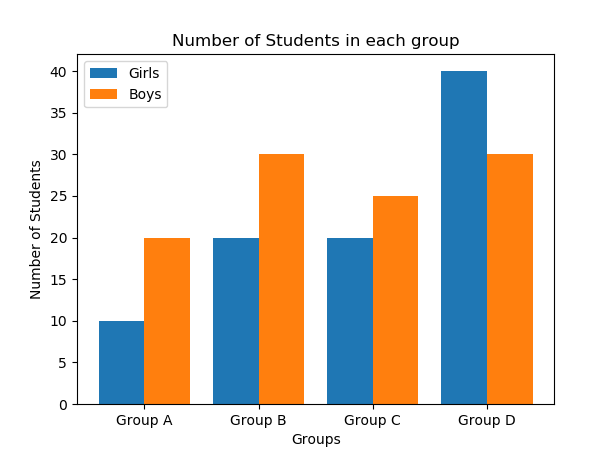
Name this graph and identify the type of data it's used for
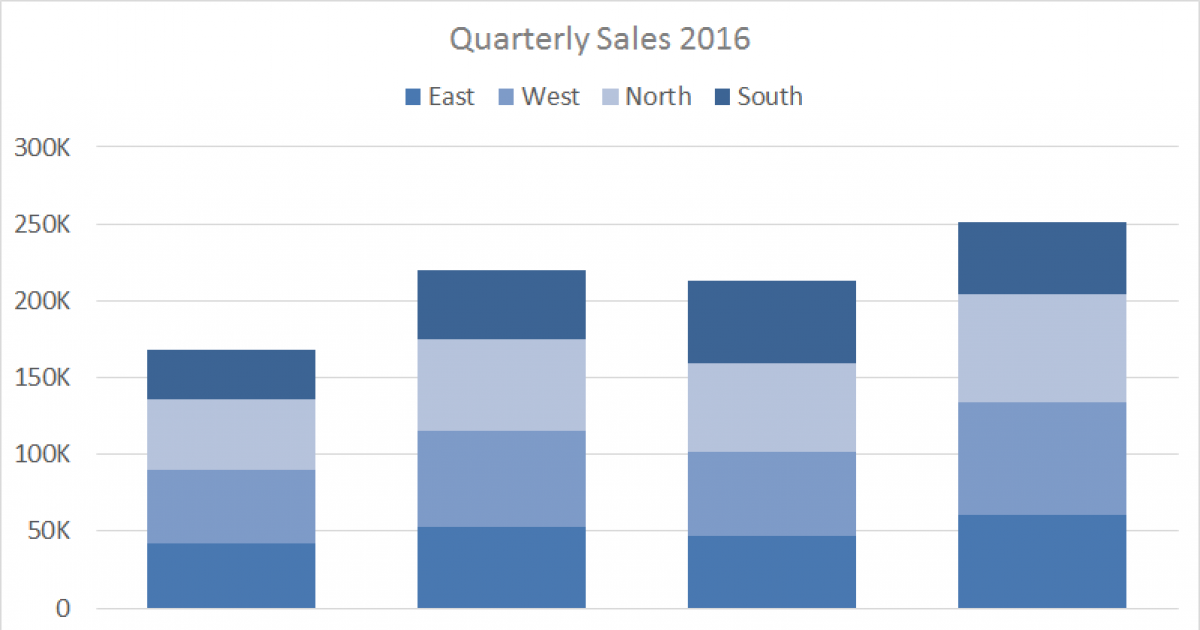
Name this graph and identify the type of data it's used for
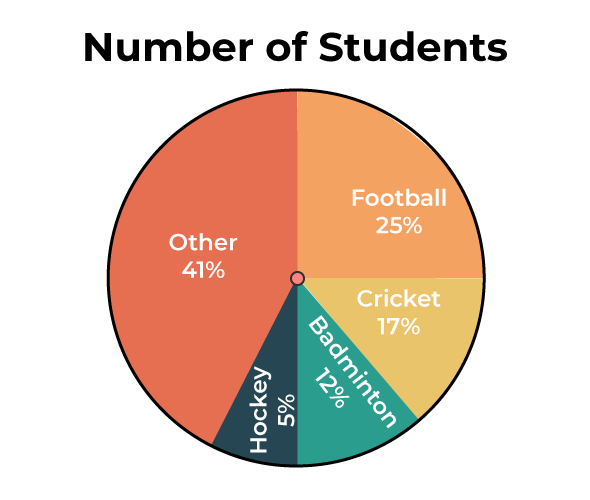
Name this graph and identify the type of data it's used for
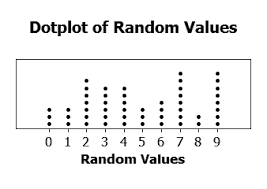
Name this graph and identify the type of data it's used for
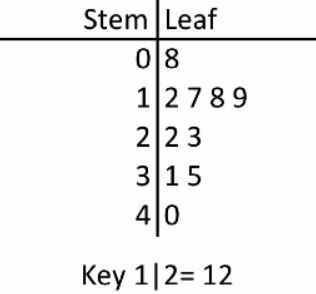
Name this graph and identify the type of data it's used for
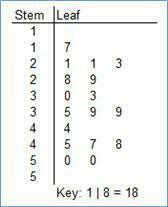
Name this graph and identify the type of data it's used for
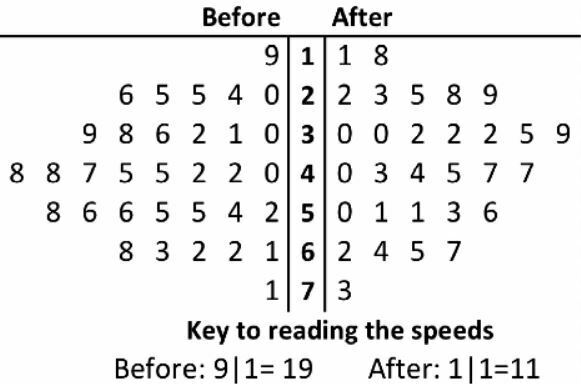
Name this graph and identify the type of data it's used for
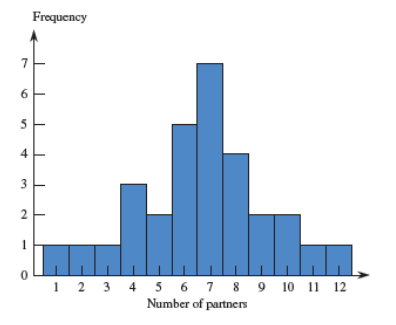
Name this graph and identify the type of data it's used for
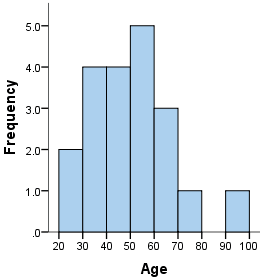
Name this graph and identify what it's used for
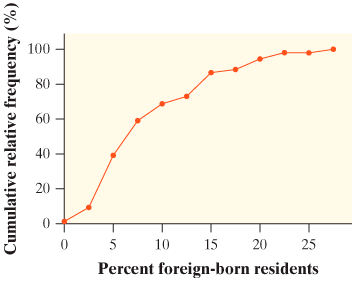
Parameter
Statistic
Degrees of Freedom
Left-Skewed
Right-Skewed
Uni-modal
Bi-modal
Multimodal
Linear Transformation Rule
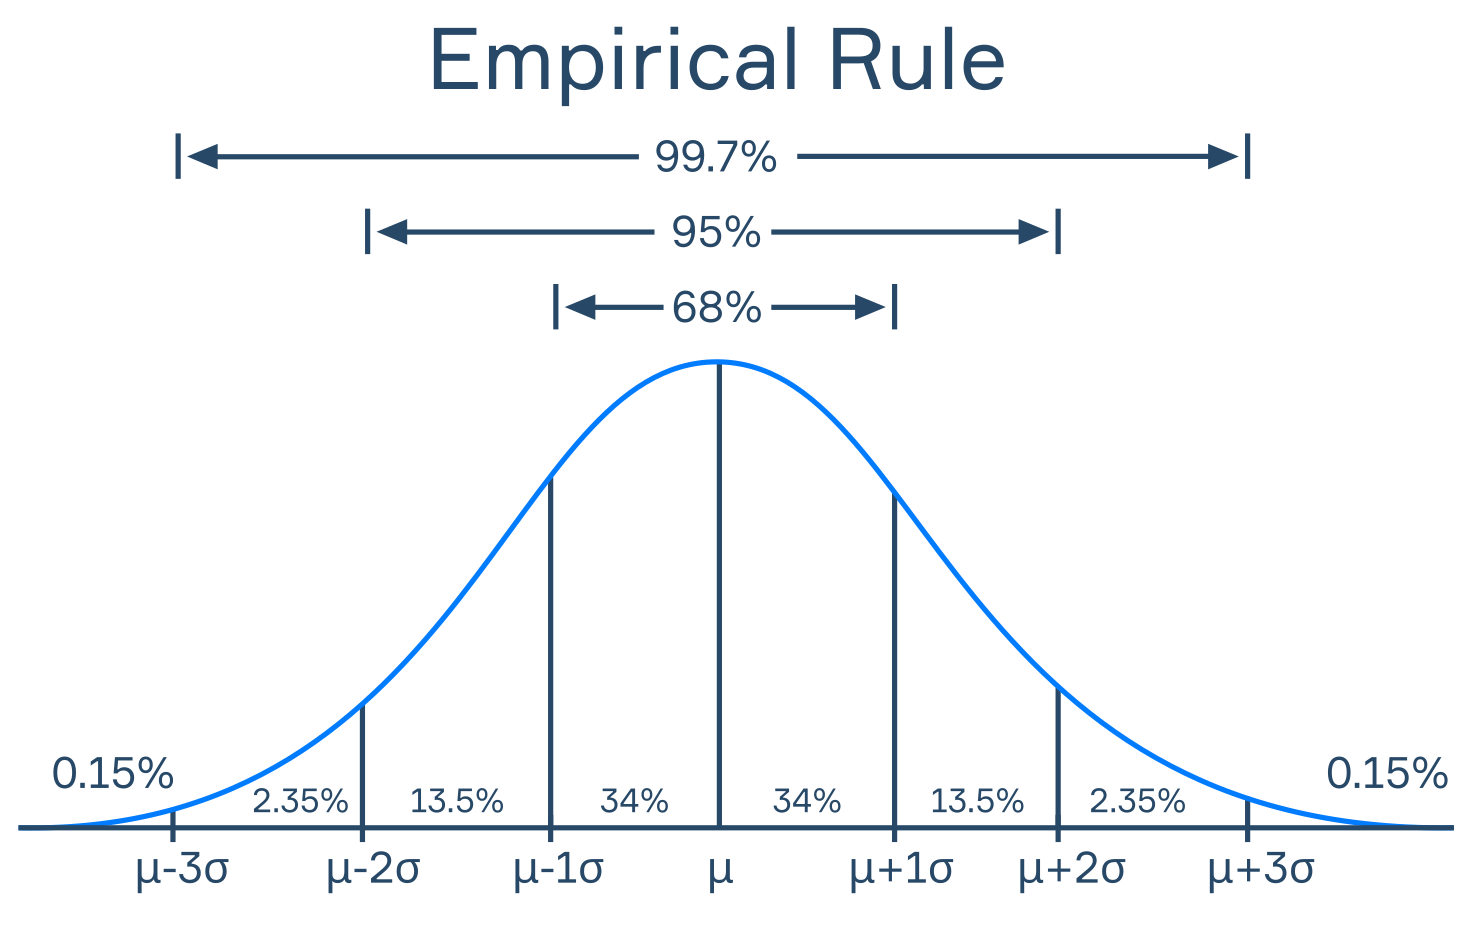
Empirical Rule
Combining Means
Combining Standard Deviations
Trimmed Mean
Boxplot Outliers
5 Number Summary
Describing Numerical Data
Name this graph and identify the type of data it's used for
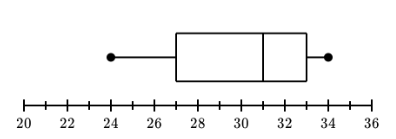
Name this graph and identify the type of data it's used for
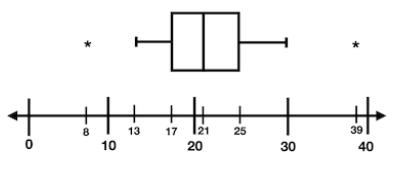
Identify the concept that this image displays
Counting
Permutation
Combination
Union (A ∪ B)
Intersection (A ∩ B)
Disjoint (Mutually Exclusive)
Independent
Hypothetical 1000
Permutation Formula
Combination Formula
Disjoint Union Formula
Non-Disjoint Union Formula
Independent Intersection Formula
Not-Independent Intersection Formula
Probability Formula (Equallly Likely Outcomes)
Conditional Probability
At Least One Formula
Exactly One Formula
Explanatory Variable
Response Variable
Correlation
Correlation Coefficient (r)
Least Squares Regression Line (LSRL)
Extrapolation
Coefficient of Determination (r²)
Residual
Residual Plot
Influential Point
High Leverage Point
Outlier
a (y-int) Formula
b (slope) Formula
Interpreting the Correlation Coefficient (r)
Interpreting the Slope
Interpreting the Coefficient of Determination (r²)
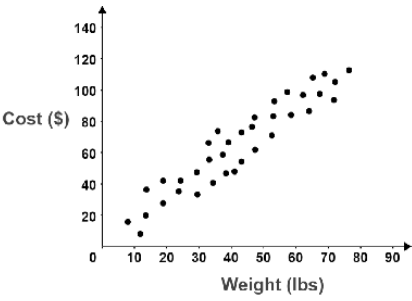
Identify the type of plot based on this image
Census
Sampling Design
5 Types of Sampling Design
Sampling Frame
Simple Random Sample
Stratified Random Sample
Systematic Random Sample
Cluster Sample
Multistage Sample
Bias
6 Types of Bias
Voluntary Response
Convenience Sampling
Undercoverage
Nonresponse
Response Bias
Wording of Questions
Observational Study
Experiment
Survey
Experimental Unit
Factor
Response Variable
Level
Treatment
Control Group
Placebo
Blinding
Double Blind
Confounding Variable
Block
3 Types of Experimental Design
Completely Randomized
Randomized Block
Matched Pairs
5 Parts of a Simulation
Model
Trial
Assumptions
Chart
Conclusion
Binomial Distribution
Geometric Distribution
cdf
Mean of Linear Function
Standard Deviation of Linear Function
Unusual Distribution
Uniform Distribution
Normal Distribution
Standard Normal Distribution
Normal Probability Plot
Trapezoid Formula
Rectangle Formula
Triangle Formula
Height of Uniform Dist.
Probability of Uniform Distribution
Mean of Uniform Dist.
Standard Deviation of Uniform Dist.
Probability of Normal Dist.
X-value of Normal Dist.
Standardization Formula
When SD increases, what happens to the normal curve?
When SD decreases, what happens to the normal curve?
Identify the type of density curve based on this image
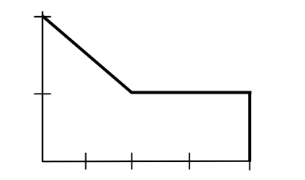
Identify the type of density curve based on this image
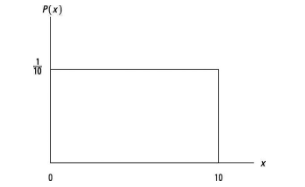
Identify the type of density curve based on this image
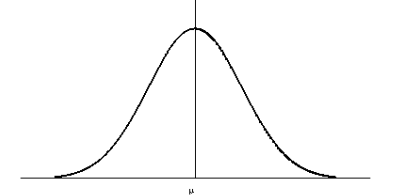
Identify the type of density curve based on this image
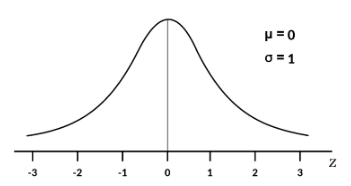
Sampling Variability
Point Estimate
Confidence Interval
Confidence Level
Confidence Interval Default Formula
Z-score Formula
p̂
Null Hypothesis (H0)
Alternate Hypothesis (Ha)
Test Statistic
P-value
Level of Significance (α)
Test Statistic Default Formula
P-value for Proportions
np Tests
Type I Error
Type II Error
Consequences
Relationship between α and β
Power
What happens if alpha increases?
What happens if n increases?
What happens if P0 - Pa increases?
np Tests (2-Prop)
Central Limit Theorem
t Distribution
df (t-Dist)
P-value for Means
T-score Formula
Central Limit Theorem (2-Samp)
Pooled t Inference
df (Matched Pairs)
df (2-Samp)
k
χ² test
GOF test
Homogeneity
Independence
Expected Counts (GOF)
Expected Counts (Homoegeneity and Independence)
df (GOF)
df (Homogeneity and Independence)
P-value (Chi-squared)
Identify the type of distribution based on this image
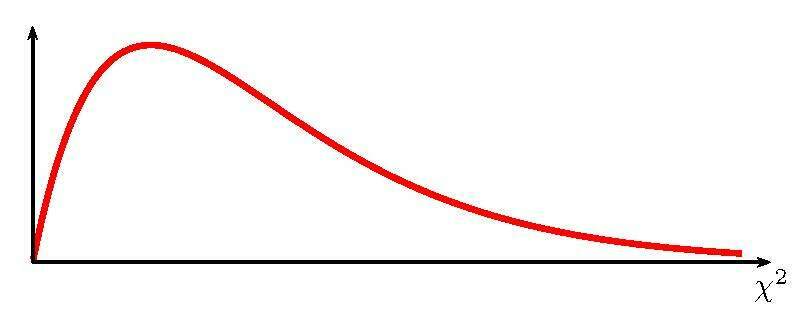
Deterministic Relationship
Error Variable (e)
Test Statistic (LinReg)
P-Value (LinReg)
df (LinReg)

 Hide known cards