Created by Daniel Cox
over 8 years ago
|
||
Copied by Daniel Cox
over 8 years ago
|
||
What does it mean if events A and B are mutually exclusive?
Also, \(P(A\cap B)=?\)
What does it mean if events A and B are independent?
Also, \(P(A\cap B)=?\)
\[P(A|B)=?\] (there is a rearranged version of this given in the formulae book)
If events A and B are independent, then \(P(A|B)=?\)
If events A and B are independent, then \(P(B|A)=?\)
The addition law for events A and B is \[P(A\cup B)=?\] (given in formulae book)
\[P(A')=?\]
For events A and B that are NOT independent, \[P(A\cap B)=?\]
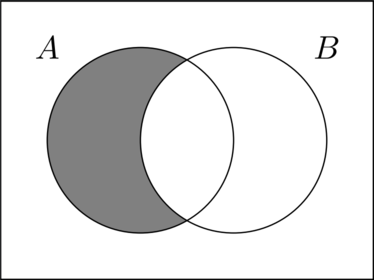
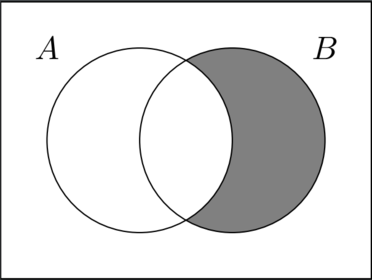
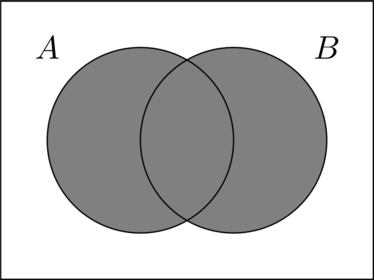
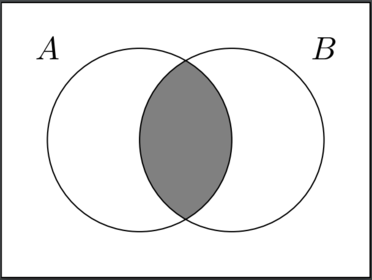
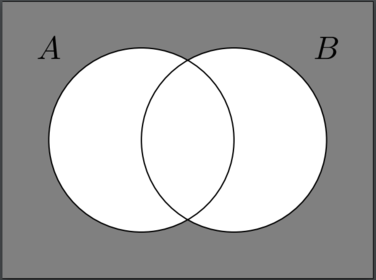
Describe this shaded area using set notation
What is a sample space?
For any discrete random variable \(X\),\[\text{E}(aX + b) = ?\]
For any discrete random variable \(X\),\[\text{Var}(aX + b) = ?\]
For a discrete random variable \(X\) taking values \(x_i\) with probabilities \(p_i\), \[\text{E}(X)=?\] (given in formulae book)
For a discrete random variable \(X\) taking values \(x_i\) with probabilities \(p_i\), \[\text{Var}(X)=?\] (given in formulae book)
Describe this shaded area using set notation
Describe this shaded area using set notation in two ways
How is variance related to standard deviation?
The cumulative distribution function for a discrete random variable: \[F(x_0)=P(?)\]
If \(X\) has a normal distribution with mean \(\mu\) and standard deviation \(\sigma^2\), how do you transform it to the \(Z\) distribution?
\[\text{Interquartile range (IQR)}=?\]
What is the formula for the mean of a set of data?
What is the underlying feature associated with each of the bars in a histogram?
How do you find the range of a set of data?
What is the formula for the standard deviation of a set of data?
What is a continuous variable?
What is a discrete variable?
What is \(r\) (the product moment correlation coefficient) a measure of?
\(r\) is the product moment correlation coefficient \[\begin{align*}
r=1 &\Rightarrow ?\\
r=-1 &\Rightarrow ?\\
r=0 &\Rightarrow ?\\
\end{align*}\]
On a histogram, \(\text{frequency density}=?\)
If \(Q_2-Q_1<Q_3-Q_2\), what type of skew does the data have?
If \(Q_2-Q_1>Q_3-Q_2\), what type of skew does the data have?
If \(Q_2-Q_1=Q_3-Q_2\), what type of distribution do we have?
If \(\text{mode}<\text{mean}<\text{median}\), what type of skew do we have?
(This is true even if we only know 2 of mean, mode and median)
If \(\text{mode}=\text{mean}=\text{median}\), what type of distribution do we have?
(This is true even if we only know 2 of mean, mode and median)
If \(\text{mode}>\text{mean}>\text{median}\), what type of skew do we have?
(This is true even if we only know 2 of mean, mode and median)
How would you use the formula \(\frac{3(\text{mean}-\text{median})}{\text{standard deviation}}\) to determine how skewed some data are?
Which measures of location and dispersion are affected by extreme values?
Which measures of location and dispersion are NOT affected by extreme values?
When comparing data sets, what 3 measures could you use in your comparison?
What is meant by an independent (or explanatory) variable?
What is meant by a dependent (or response) variable?
Is the product moment correlation coefficient affected by coded data?
For a discrete uniform distribution \(X\) defined over the values \(1, 2, 3, ..., n\), \[\text{E}(X)=?\]
For a discrete uniform distribution \(X\) defined over the values \(1, 2, 3, ..., n\), \[\text{Var}(X)=?\]