15812221
Descripción
Test por Wallace Mason, actualizado hace más de 1 año
|
|
Creado por Wallace Mason
hace más de 5 años
|
|
Pregunta 1
Pregunta
A temperature anomaly is a....
Respuesta
-
a value above or below a "normal" value
-
baseline or normal value
-
the value of zero on the y-axis
Pregunta 2
Pregunta
Temperature anomalies are more useful because than raw temperature data because...
Respuesta
-
anomaly data will tell us extremes
-
anomaly data shows how hot or cold a region gets
-
anomaly data can show increases and decreases of temperature in the same region
-
anomaly data tells us what the "normal" temperatures are...
Pregunta 3
Pregunta
The baseline or normal value of the temperature graph we used in class is from
Respuesta
-
1990-2010
-
1880
-
1951-1980
-
2018
Pregunta 4
Pregunta
How many straight years has the planet earth had a positive temperature anomaly...
Respuesta
-
1
-
10
-
43
-
0
Pregunta 5
Pregunta
A value above normal is a...
Respuesta
-
positive anomaly
-
negative anomaly
Pregunta 6
Pregunta
Why do you think we use 1951-1980 as our "normal" or zero value, especially considering climate change was likely happening during this time?
Respuesta
-
That was probably when we started burning fossil fuels
-
The data, especially ocean data, was pretty inaccurate and started getting better starting in 1950's...
-
scientists do not want to scare people so they use a "normal" value that keeps the temperature anomalies lower.
Pregunta 7
Pregunta
What does zero mean on the y-axis of a temperature anomaly graph?
Respuesta
-
the maximum anomaly
-
the minimum anomaly
-
unknown data
-
the "normal" or baseline data.
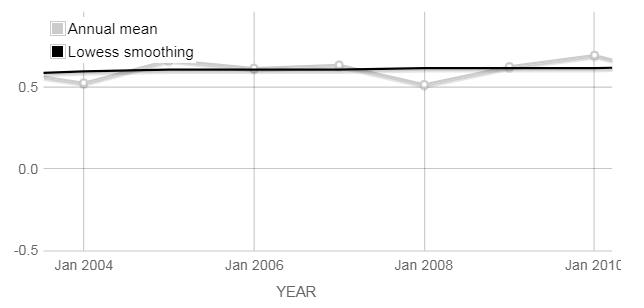
Pregunta 8
Pregunta
Temperatures did not rise from 2005 to 2010, this means climate change may not be happening. This is an example of...
Image:
2010 (binary/octet-stream)
Respuesta
-
cherry picking
-
reliable data
-
anomaly
¿Quieres crear tus propios Tests gratis con GoConqr? Más información.