17436857
Descripción
Test por Lourdes Torralba, actualizado hace más de 1 año
|
|
Creado por Lourdes Torralba
hace más de 5 años
|
|
Pregunta 1
Pregunta
In 1976, the JUSE saw the need tor tools to promote innovation, communicate information and successfully plan major projects.
Respuesta
- True
- False
Pregunta 2
Pregunta
The new 7 tools replaced the 7 basic quality tools.
Respuesta
- True
- False
Pregunta 3
Pregunta
The new 7 tools were developed to organize [blank_start]verbal[blank_end] data [blank_start]diagrammatically[blank_end].
The basic 7 tools are effective for data analysis, process control, and quality improvement ([blank_start]numerical[blank_end] data).
Respuesta
-
verbal
-
hypothetical
-
numerical
-
diagrammatically
-
in text
-
with images
Pregunta 4
Pregunta
These tools are part of the seven basic:
Respuesta
-
PDPC
-
Pareto chart
-
Scatter diagrams
-
Tree diagram
Pregunta 5
Pregunta
The cause and effect diagram is also known as:
Respuesta
-
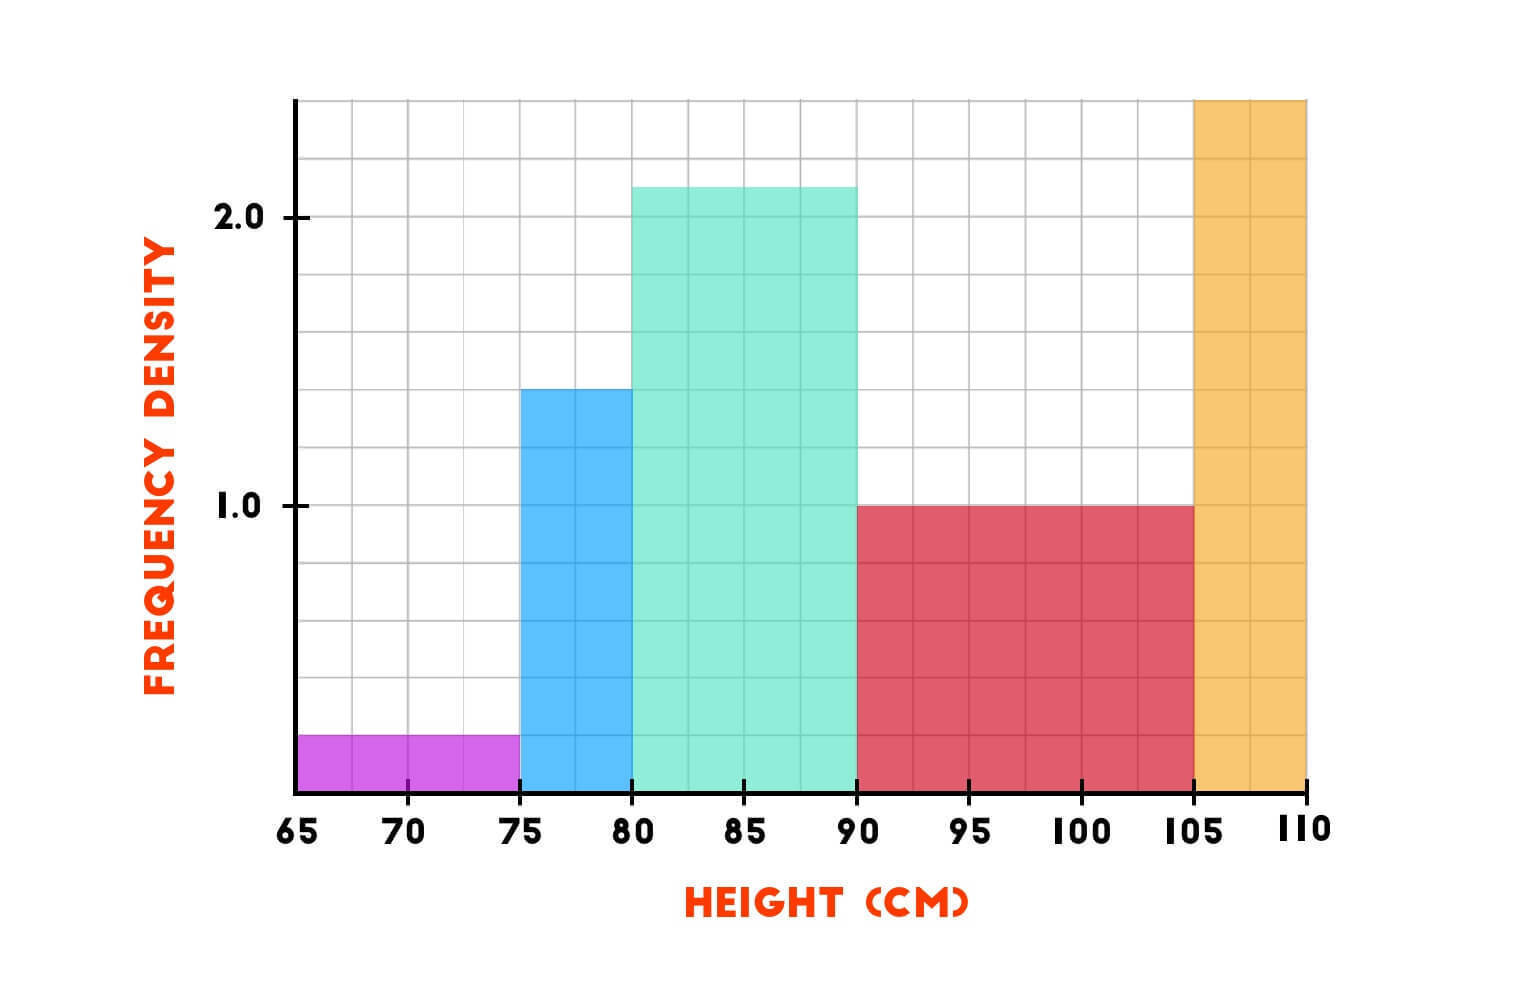
Histogram
-
Fish bone diagram
-
Flowchart
Pregunta 6
Respuesta
-
Check sheet
-
Pareto chart
-
Scatter diagram
Pregunta 7
Pregunta
Which is the name of the tool represented by this image?
Respuesta
-
Cause and effect diagram
-
Histogram
-
Ishikawa diagram
Pregunta 8
Pregunta
The basic seven tools:
-Define problem [blank_start]after[blank_end] collecting numerical data.
-[blank_start]Analytical[blank_end] approach.
The new seven tools:
-Define problem [blank_start]before[blank_end] collecting [blank_start]numerical[blank_end] data.
-Generate ideas, [blank_start]formulate[blank_end] plans.
Respuesta
-
after
-
before
-
Analytical
-
formulate
-
numerical
Pregunta 9
Pregunta
Gathers large amounts of verbal data; then organizes the data into groups based on natural relationship.
Respuesta
-
Tree diagram
-
Affinity diagram
-
PDPC
Pregunta 10
Pregunta
Allow a team to systematically identify, analyze and classify the cause and effect relationships that are not easily recognizable and exist among all critical issues.
Respuesta
-
Matrix Diagram
-
Pareto Chart
-
Relations Diagram
Pregunta 11
Pregunta
The arrow diagram is also known as systematic diagram?
Respuesta
- True
- False
Pregunta 12
Pregunta
The tree diagram is also known as or dendrogram?
Respuesta
- True
- False
Pregunta 13
Pregunta
When do we use matrix diagram?
Respuesta
-
When we need to evaluate quantitatively.
-
When the price of failure is high.
-
When we want to summarize customers requirements and compare them to the characteristics to achieve them.
-
When we want to relate to groups (or more) of ítems to each other to give information about the relationship.
-
After a brainstorming exercise.
Pregunta 14
Pregunta
We use arrows diagram for working out optimal schedules and controlling them effectively.
Respuesta
- True
- False
Pregunta 15
Pregunta
In the latest 3 years, people stopped using nodes for the arrows diagram.
Respuesta
- True
- False
Pregunta 16
Pregunta
¿What is the meaning of PDPC?
[blank_start]Process Decision Program Chart[blank_end]
Respuesta
-
Process Decision Program Chart
Pregunta 17
Pregunta
Identifies what might go wrong in a plan under development. Countermeasures are developed to prevent those problems.
Respuesta
-
Tree diagram
-
Relations diagram
-
Histograms
-
PDPC
Pregunta 18
Pregunta
These "steps" are part of PDPC:
Respuesta
-
Countermeasure
-
Relations
-
Plan
-
Categories
-
Problems
Pregunta 19
Pregunta
List the 7 new tools:
[blank_start]Affinity Diagram[blank_end][blank_start]Relations Diagram[blank_end]
[blank_start]Tree Diagram[blank_end]
[blank_start]Matrix Diagram[blank_end]
[blank_start]Arrows Diagram[blank_end]
[blank_start]PDPC[blank_end]
[blank_start]Prioritization Matrix[blank_end]
Respuesta
-
Affinity Diagram
-
Flow chart
-
Relations Diagram
-
Check sheet
-
Tree Diagram
-
Cause and effect diagram
-
Matrix Diagram
-
Pareto chart
-
Arrows Diagram
-
Control charts
-
PDPC
-
Histograms
-
Prioritization Matrix
-
Scatter diagrams
Pregunta 20
Pregunta
List the 7 basic quality tools:
[blank_start]Flowchart[blank_end].
[blank_start]Check Sheet.[blank_end] [blank_start]Cause and Effect (fish bone) Diagram.[blank_end]
[blank_start]Pareto Chart.[blank_end]
[blank_start]Control Charts.[blank_end]
[blank_start]Histograms.[blank_end]
[blank_start]Scatter Diagrams.[blank_end]
Respuesta
-
Flowchart
-
Affinity diagram
-
Check Sheet.
-
Relations diagram
-
Cause and Effect (fish bone) Diagram.
-
Tree diagram
-
Pareto Chart.
-
Matrix diagram
-
Control Charts.
-
Arrows diagram
-
Histograms.
-
PDPC
-
Scatter Diagrams.
-
Prioritization matrix
Pregunta 21
Pregunta
Benefits of New 7 quality tools:
Respuesta
-
Provide training in thinking.
-
Express verbal data diagrammatically.
-
Raise people's problem solving confidence.
-
Make information visible.
-
Get more people involved.
-
Increase people's ability to predict future events.
Pregunta 22
Pregunta
The tool that you can see in the image refers to:
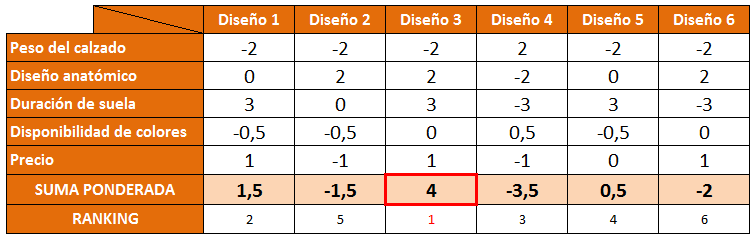
Respuesta
-
Matrix Diagram
-
Prioritization Matrix
-
C Matrix
¿Quieres crear tus propios Tests gratis con GoConqr? Más información.