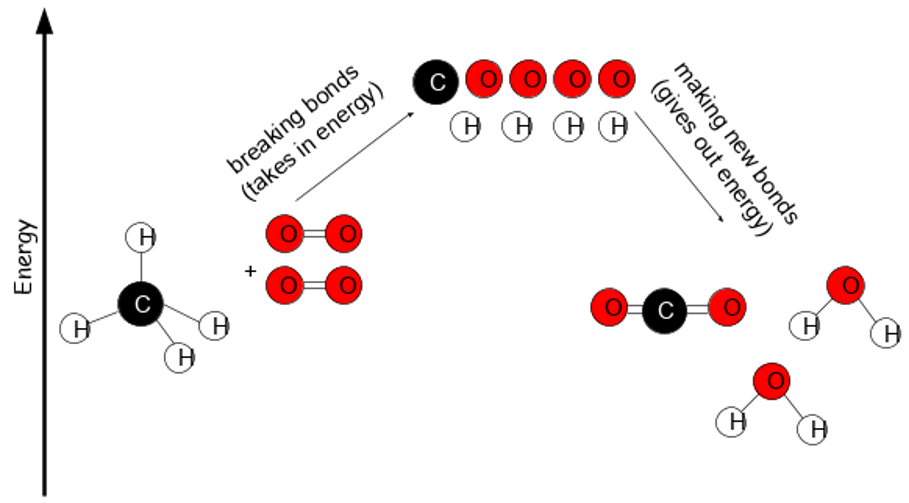
An energy level diagram can be used to show how the energy stored in chemicals changes during a chemical reaction. In endothermic reactions the products have more energy than the reactants. In exothermic reactions the products have less energy than the reactants.
Pie de foto: : Bonds broken and made in an endothermic reaction
Diapositiva 3
Bond Energy
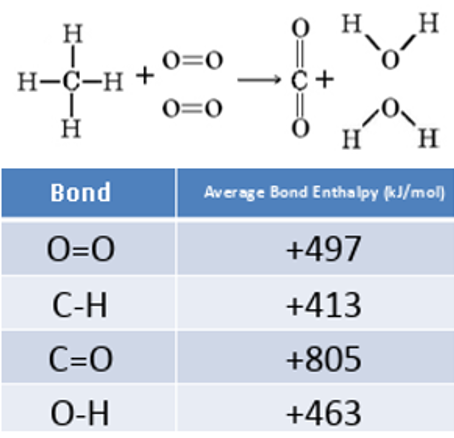
Bond energy is measured in kj/mol. We can use bond energy to calculate the energy change for many reactions. The energy released when a bond is formed or absorbed when it is broken is called the bond energy.
e.g. the C-H bond in methane has a bond energy of 413 kj/mol
Pie de foto: : All chemical reactions involve the breaking of old bonds followed by the making of new bonds.
Diapositiva 4
Bond Energy
To calculate the standard enthalpy of reactions:
Sum of bond enthalpies of bonds broken - sum of bond enthalpies of bonds made
((2x497) +(4x413))-((2x405)+(4x463))
= -816kj/mol