3918979
Descripción
Fichas por Jaber Rising, actualizado hace más de 1 año
|
|
Creado por Jaber Rising
hace alrededor de 9 años
|
|
| Pregunta | Respuesta |
| What is EEG? | Electroencephalography is the recording of electrical activity/potential differences of the brain from the scalp, on the surface of the brain (intracranial), or within the substance of the brain (depth). It literally means 'A recording of what is inside the head', although it is difficult to isolate only the activity of the brain and other sources generate artefact that interfere with the recording. |
| EEG measurement | - Measures time varying voltages (mV) - Spatial distribution from multiple electrodes |
| EEG measurement Typical signal | • Typical filters: – 0.15 Hz high pass – 105 Hz low pass • Typical digitisation – 256/512 Hz sampling rate – 14 bit A/D conversion – 32-64 channels |
| EEG measurement EEG can be measured from | • the scalp, • intracranially on the cortex (subdural EEG), • deeper parts of the brain (depth EEG). SCALP, CORTICAL, & DEPTH. |
| EEG measurement The electrodes must be | - The electrodes used at each location must be of the appropriate size and materials. - Intracranial electrodes must be bio-compatible. |
| EEG waveforms: Normal Awake | Alpha rhythm: - 8-12Hz rhythm observed in most people when they close their eyes. - Occurs generally in posterior electrodes. - Considered a sign of good mental health, although some perfectly healthy people have no alpha rhythm. |
| EEG waveforms: Standardising EEG is so varied that it defies standardisation. However, some common frequency ranges have been defined for reference: | – Delta: less than 3 Hz. Dominant rhythm in infants (< 1 year old) and in stages 3 and 4 of sleep – Theta: 3.5 – 7.5 Hz. “Slow” activity – Alpha: 7.5 – 13 Hz. Appears when closing the eyes and relaxing – Beta: 14 – 20 Hz. “Fast” activity. Dominant rhythm when eyes are open – Gamma: 20-100 Hz. “Faster” activity |
| Artefact Other sources contribute to the EEG measurement. This is known as artefact. | - Eye blinks, Chewing and Lead noise. Analysis must account for this unwanted interference. |
| Uses of EEG | The EEG is a useful medical tool: - Diagnosis: Helps with identifying a disorder. - Treatment: Helps with ensuring that treatment is correctly administered. - Research: Helps us investigate a wide variety of problems. |
| Currents exist in the brain because of | flow that occurs: - At the synapses - At the cell body (start of action potential) - At the axon (action potential transmission) - In the extra-cellular body (CSF) cerebrospinal fluid. The extra-cellular currents are the most important for the EEG |
| Electric fields of the brain The flow of ions into and out of neurons generate charge differences in the CSF that cause currents that can be measured by the EEG. Cell membranes are highly resistive and currents within the cell DO NOT contribute to the EEG. | |
| Electric fields of the brain Electric fields in the brain are caused by | Chemical currents of charged ions. Because of the movement of ions is slow, we can ignore magnetic effects and concentrate on electric phenomena. Currents are caused by the attraction between charged particles, described by forces between them. We start by looking at the electric fields generated by single charges. |
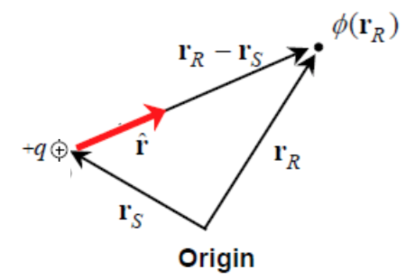
| Single Charges | The electric field generated by a particle is described by |
| rR = an arbitrary position vector ε0 = permittivity of free space q = charge of the particle r = unit vector pointing in the direction from source location rS to recording location rR || ||=magnitude of the vector rR – rS = R Electric fields are measured in units of V/m | |
| Single Charges Electric potential (voltage) is related to electric field as | |
| Many charges The total electric potential generated by many charges is dictated by the principle of superposition, that is, the sum of all charges. | |
| When there are only two charges, known as a dipole, this equation simplifies to | |
| Because the measurement of EEG is far from the sources, a volume containing many charges can be | approximated by a single dipole, provided there is roughly an equal number of positive and negative ions within it. This is known as an equivalent dipole and is useful in approximating the activity in small volumes of the brain. |
| Equivalent Current Dipoles For equivalent electric dipoles we still need to know a rough distribution of all charges in the brain. This is difficult! | Instead, we use a current dipole, with current sources and sinks instead of positive and negative charges. A current dipole produces an electric potential similar to a charge dipole |
| MACROSCOPIC PITENTIALS (HOMOGENOUS MEDIUM) | The electric potential generated by many small volumes of the brain matter can be approximated by the sum of the equivalent dipole representing each small volume. |
| G ( rS , rR ) is known as the | Green’s function; it represents the effects of the material between source location, rS, and recording location, rR. In a homogeneous medium, the properties of the material are the same throughout. G(rS,rR) is a function of the distance between distance and how conductive the material is. |
| Macroscopic Potentials (Inhomogeneous medium) The human head is NOT homogeneous. | Green’s function of a realistic head model must include the boundaries between the layers of different types of materials found in the head. Macroscopic potentials can be estimated numerically or analytically when the head is simplified to a spherical model. |
| Simplifications Parallel dipoles generate potentials much larger than dipoles that are randomly oriented. If you have N parallel dipoles, you need N^2 randomly oriented ones to generate the same field. | |
| Simplifications In the brain, the neurons in the cortex are aligned and often large areas are activated together. | Because of this alignment the potentials in the cortex are much more influential to the EEG than those in deeper structures. An appropriate simplification is to consider a sheet of dipoles rather than a volume. This sheet is a representation of the dipoles in the cortex only. |
| Simplifications Resulting model of EEG measurement | |
| Synchronicity Synchronous dipoles, that is, dipoles activated in unison, generate potentials much larger than dipoles that asynchronous. If you have N synchronously active dipoles, you need N2 asynchronous ones to generate the same field. | |
| Macroscopic EEG Using this model, simulations show that the measured voltages are affected by large areas of cortex. Nearby dipoles affect the EEG more than far away ones. | |
| Macroscopic EEG In reality all recordings are bipolar. Larger areas are involved. | |
| Even before re-referencing, voltages are measured between two points. The reference electrode normally used is on top of the head. | |
| MACROSCOPIC EEG Because large areas affect the EEG, a large measurement of EEG can be equally generated by | 1. A few dipoles near the electrode. 2. Many dipoles far away from the electrode 3. A few dipoles of large magnitude. 4. Many dipoles of small magnitude. 5. A few synchronously active dipoles 6. Many asynchronous dipoles or a combination of any of these. THE EEG IS AN AMBIGUOUS MEASUREMENT This is supported by large variability observed in the EEG. The EEG is limited in what it can tell us. |
| SUMMARY • The EEG is a measurement of the average activity of a relatively large area of cortex that contains up to billions of neurons. • The EEG usually contains artefact, which can be caused by many different sources. • The EEG is very useful in the diagnosis, treatment, and research of disorders such as epilepsy. | Summary • The EEG generators can be approximated by the sum of dipoles, each describing the average activity of neurons in a small volume • Because aligning dipoles generates much larger potentials than if they are randomly oriented, the scalp EEG is predominantly a measurement of cortical activity. • The activity in the cortex can be modelled/approximated as a sheet of dipoles. • Because of the large cortical are as involved,the EEG is an ambiguous measurement. |
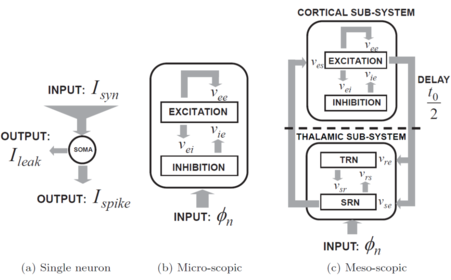
| Meso-scopic Models modelling the brain Simplifications are required: | • Model the average activity in a small region of cortex. • Reduce the parameter space – model just the average firing rates. • Tackle a smaller problem – just model a relevant area of the brain. |
| The Cortical Column | We assume that the average activity within sub- systems of the brain sufficiently describes the activity of interest. The sub-system that is usually considered is called the “cortical column”. |
| Phenomenological Models Phenomenology: | used in science to describe a body of knowledge that relates empirical observations of phenomena to each other |
| Pyramidal neurons | a type of neuron found areas of the brain including the cerebral cortex, the hippocampus and the amygdala. |
| A cortical column is modelled as | interconnected populations of neurons. |
| A Model of a Column Even this rather simple system is very difficult to analyse. The complications are: | • The non-linearity, as in the equation below. • The delay in the model, which makes it infinite dimensional. |
| Analysis of the column Model | Typical analysis proceeds as follows: 1. Compute steady state solutions. All variables are constant. 2. For each steady state solution, linearise the model. 3. Using the linearised model, analyse its stability. 4. Interpret stability boundaries in the context of the EEG signal. |
| Linearise the Model Linearisation is Linear systems are much easier to analyse. | a way to estimate a non-linear model as a linear model. Linearisation is performed by approximating a non-linear curve f (x) by a linear one. This is done at an OPERATING POINT Xo as |
| OPERATING POINT | |
| The linearised model is a good | approximation of the non-linear model if any changes made to the system are small. if large changes occur, the linearisation is not valid. |
| The linearised model Transfer function, Input and Output. | |
| The linearised Model The overall system transfer function is: | |
| Analysing Stability We can use the linear system transfer function to analyse stability. This is done by finding the poles of the system. | If all real parts of the poles are negative then the system is stable. Thus, the imaginary axis forms the instability boundary. |
| Examples of systems shows stability | |
| Examples of systems shows stability | |
| Analysing Stability The system can be reduced to a three co-ordinate system: | |
| Analysing Stability Using the three co-ordinate system, the boundaries of stability can be found. | This was performed by Breakspear et al. (2006) who found this stability region: |
| Analysing Stability | |
| The behaviour of the model can be analysed by studying how parameters affect the simulated EEG and comparing to experimentally recorded EEGs. | We will look at: 1. Simulating the normal EEG 2. Simulating the seizure EEG |
| Hebbian learning is a rule where a synapse is strengthened if pre- and postsynaptic neurons are | “simultaneously active”. |
| Spike-Timing Dependent Plasticity (STDP) | Synapses are potentiated if the synaptic event (EPSP) precedes the postsynaptic spike. Synapses are depressed if the synaptic event follows the postsynaptic spike. |
| STDP Learning Rule | Do it later slide 11 L21 |
¿Quieres crear tus propias Fichas gratiscon GoConqr? Más información.