2153688
Descripción

Mapa Mental por anesio.benna, actualizado hace más de 1 año
|
|
Creado por anesio.benna
hace casi 10 años
|
|
SAB4#86 Quality
Tools & Techniques
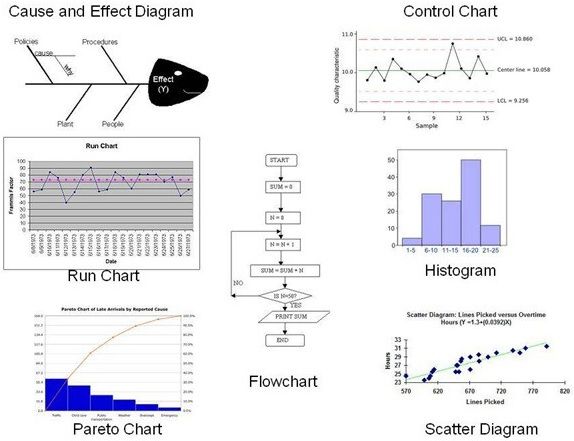
- Seven basic quality tools. The main methods used
for measuring quality across the project
- Cost of quality
- Is WHAT is adding in cost relating with prevention
and inspection activities (not testing). It includes any
time spent with writing standards, reviewing
documents, analyzing causes of defects, etc
- Is WHAT is adding in cost relating with prevention
and inspection activities (not testing). It includes any
time spent with writing standards, reviewing
documents, analyzing causes of defects, etc
- Cost-benefit analysis
- How much the quality activities
will cost VS how much the project
will gain from doing them
- How much the quality activities
will cost VS how much the project
will gain from doing them
- Benchmarking
- Means using the results of Plan Quality
on other projects to set goals for your
own. Comparing defects for exemple.
- Means using the results of Plan Quality
on other projects to set goals for your
own. Comparing defects for exemple.
- Design of experiments
- It's a scientific method. It's a statistical
method, which means use statistics to
analyze the results of the experiments
- It's a scientific method. It's a statistical
method, which means use statistics to
analyze the results of the experiments
- Statistical sampling
- Looking at a representative
sample of something to
make decisions
- Looking at a representative
sample of something to
make decisions
- Meetings
- Quality Audits
- Are when your company reviews your project to see if
you are following its processes. The point is to figure
out if there are ways to help you be more effective.
- Are when your company reviews your project to see if
you are following its processes. The point is to figure
out if there are ways to help you be more effective.
- Process Audits
- Means following your Process
Improvement Plan to compare
your project's process data.
- Means following your Process
Improvement Plan to compare
your project's process data.
- Additional quality
planning tools
- Brainstorming
- Affinity
diagrams
- Force field
analysis
Nota:
- Is how engineers analyze structures to see what forces affect their use
- Nominal group
techniques
Nota:
- mean brainstorming with small groups and then working with larger groups to review and expand the results
- Matrix diagrams
Nota:
- are talbes, spreadsheets or pivot tables that help you analyze complex relationships.
- Priorization
matrices
Nota:
- let you analyze multiple issues and prioritize so you can attack the important ones first.
- Brainstorming
Recursos multimedia adjuntos
¿Quieres crear tus propios Mapas Mentales gratis con GoConqr? Más información.