33876755
| Question | Answer |
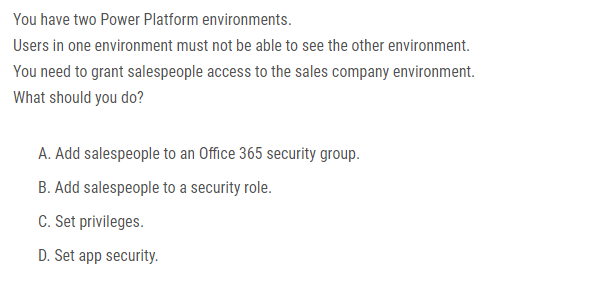
| A | |
|
Image:
2 (binary/octet-stream)
|
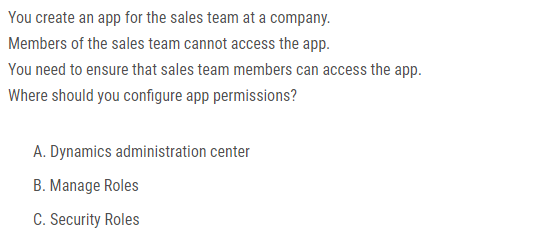
B |
|
Image:
3 (binary/octet-stream)
|
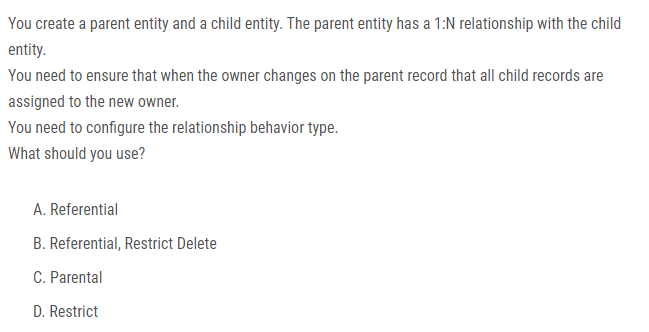
C |
|
Image:
4 (binary/octet-stream)
|
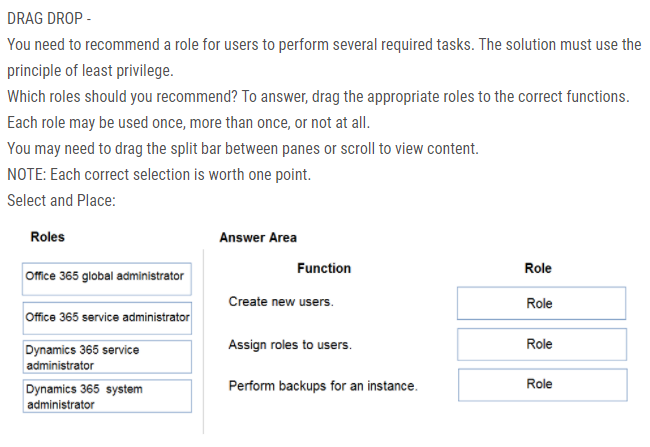
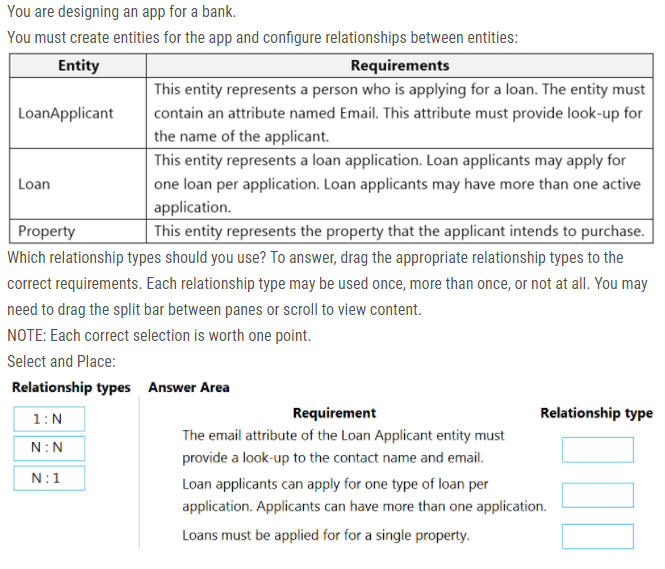
A, D, B |
|
Image:
5 (binary/octet-stream)
|
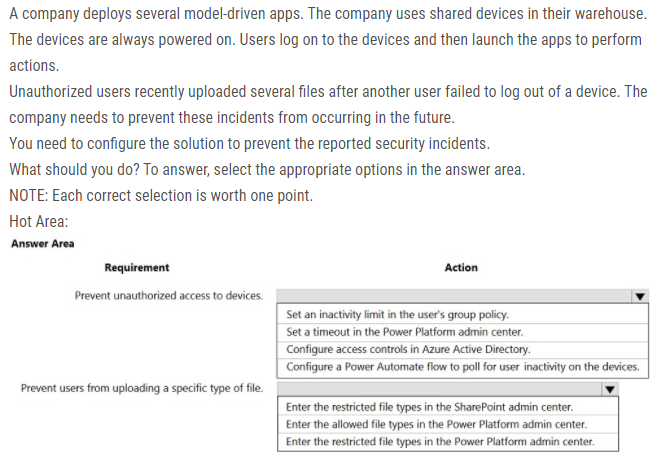
C, B, C |
|
Image:
7 (binary/octet-stream)
|
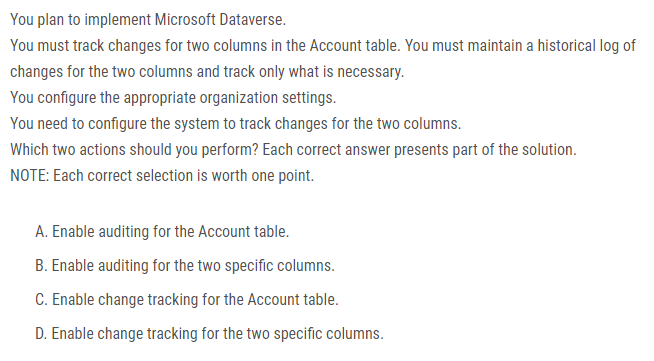
B, A |
|
Image:
8 (binary/octet-stream)
|
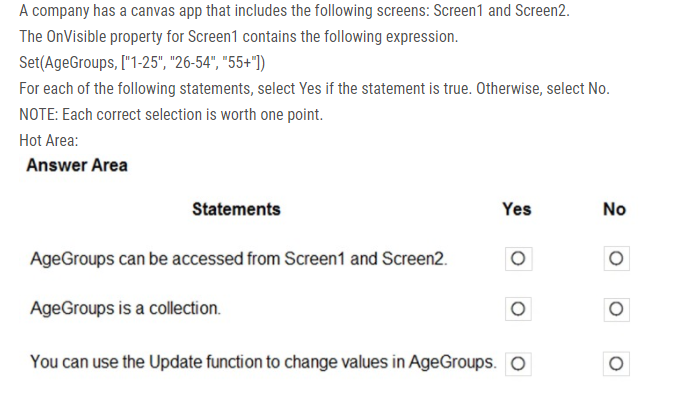
A, B |
|
Image:
9 (binary/octet-stream)
|
Y, N, N |
|
Image:
10 (binary/octet-stream)
|
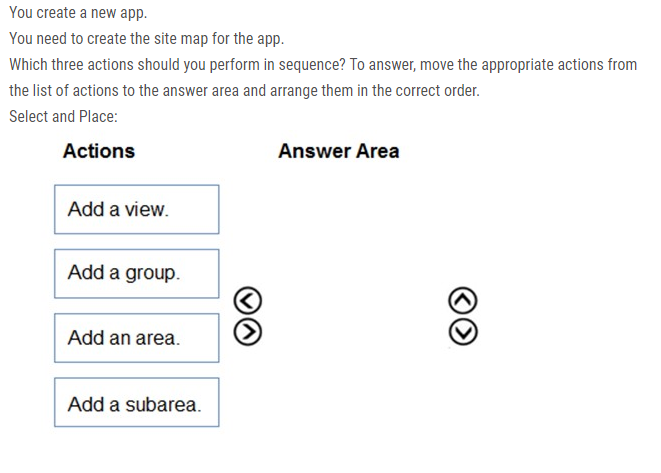
Area -> Group -> Subarea |
|
Image:
11 (binary/octet-stream)
|
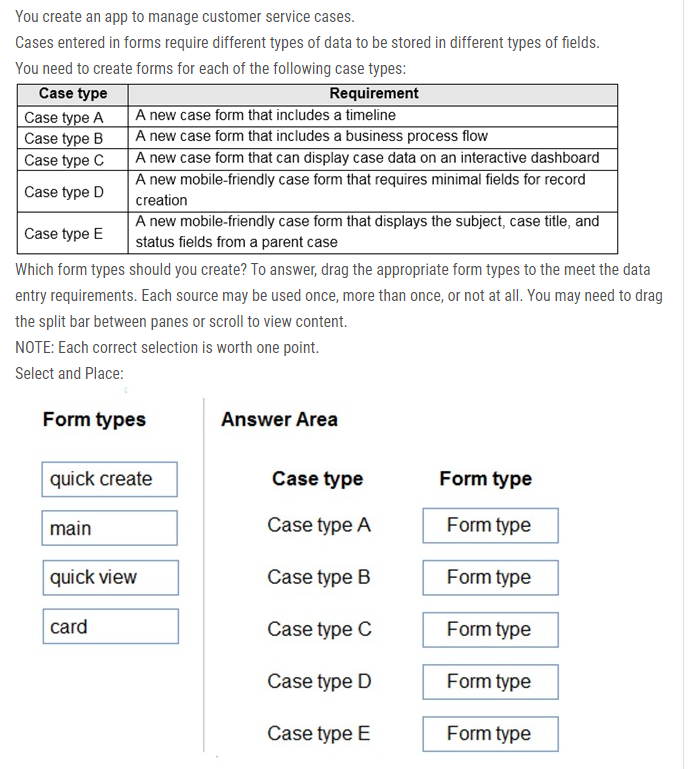
Main Main Card Quick create Quick View |
|
Image:
12 (binary/octet-stream)
|
D, A |
|
Image:
13 (binary/octet-stream)
|
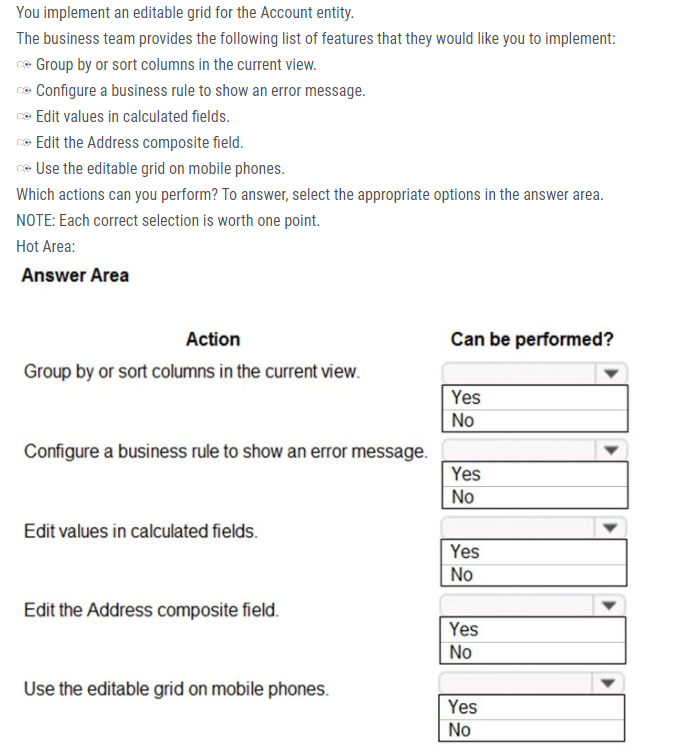
- YES. The basic thing that Editable Grid can do. - YES. Business Rules work on Editable Grid if the condition field is on the Grid View. - NO. Calculation Fields are read-only. - NO. Lookup Fields, Address Composite Fields, State/Status Fields are not editable in the Grid. - NO. Editable Grids only support Web or Tablet. |
|
Image:
14 (binary/octet-stream)
|
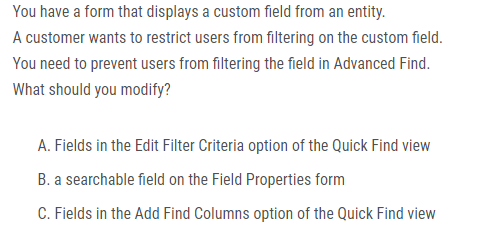
B |
|
Image:
15 (binary/octet-stream)
|
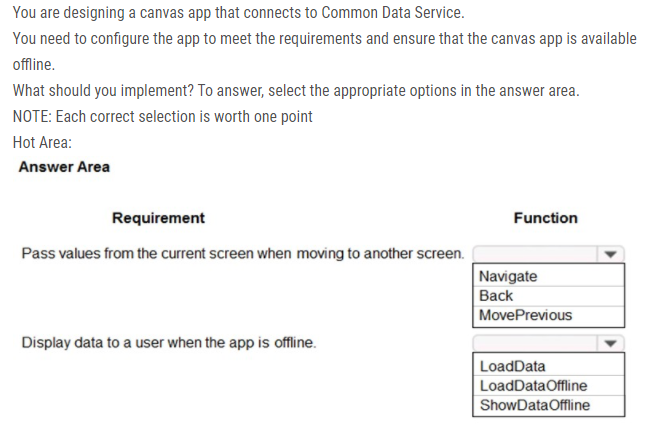
A, A |
|
Image:
16 (binary/octet-stream)
|
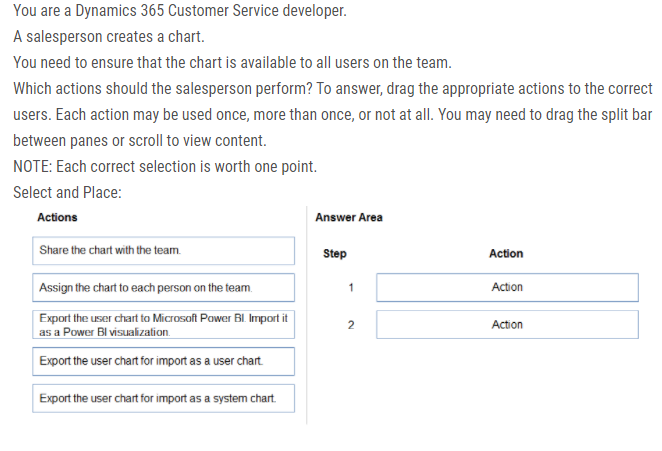
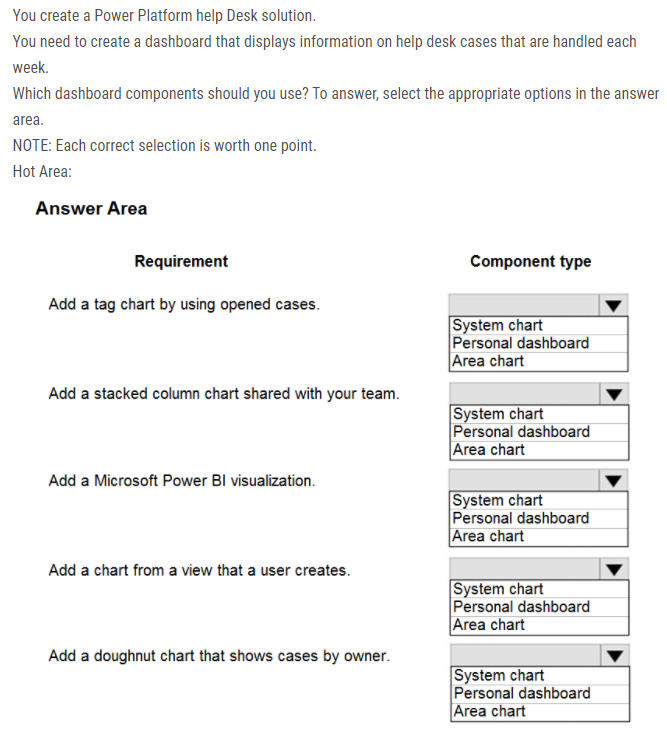
System Personal Personal Personal System (Tag and Doughnut are system only. you can't create this on personal charts for some reason). |
|
Image:
17 (binary/octet-stream)
|
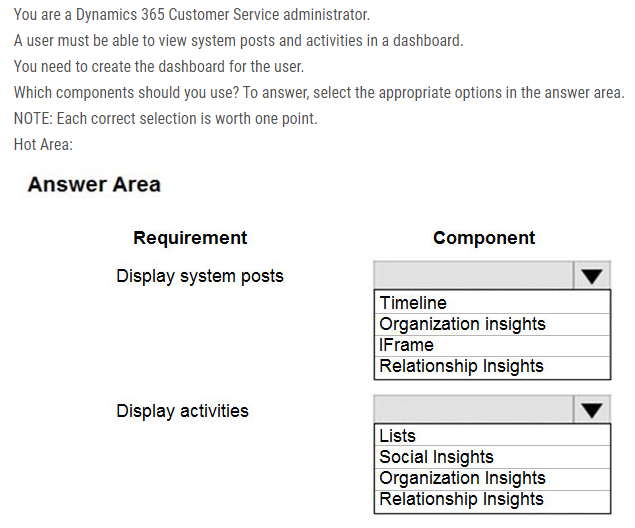
A, A https://docs.microsoft.com/en-us/dynamics365/customer-service/customer-service-hub-user-guide-timeline-admin |
|
Image:
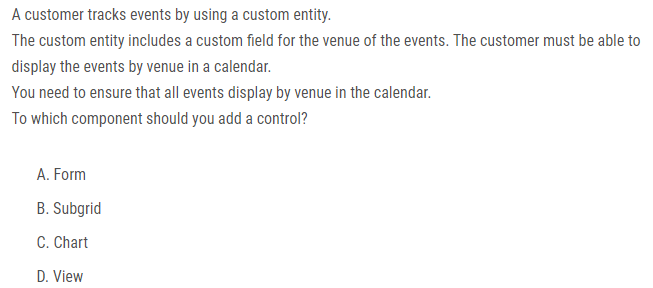
20 (binary/octet-stream)
|
D If you use unified interface, you can display any record in a calendar view via the calendar control. 1. Go to Settings->Customization->Customize the System 2. Open the configuration for the entity that you want to use the calendar control (Opportunities in our example) 3. Click the View tab 4. Click ג€Add Controlג€ and select the calendar control. 5. Click the dot for every interface from which you want the calendar control to be available. Reference: https://crmtipoftheday.com/1206/view-any-dynamics-365-record-on-a-calendar/ |
|
Image:
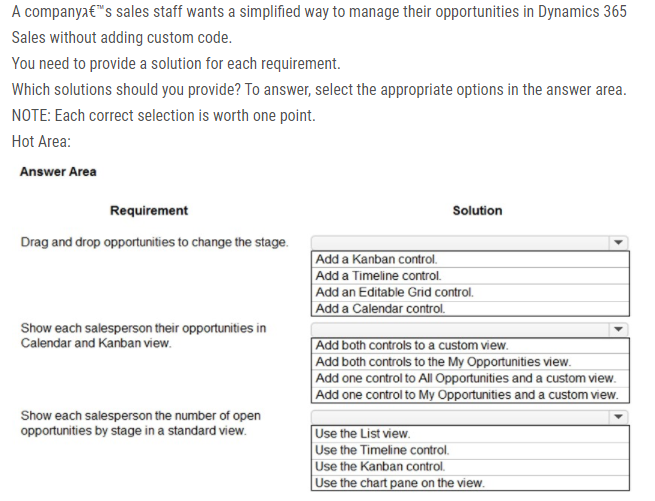
21 (binary/octet-stream)
|
Box 1: Add a Kanban control. The Kanban view allows your sales team to move opportunities from one stage to another by simply dragging them. Box 2: Add both controls to the My Opportunities view. Box 3: Use a List view (or chart as lists can not display aggregated data) |
|
Image:
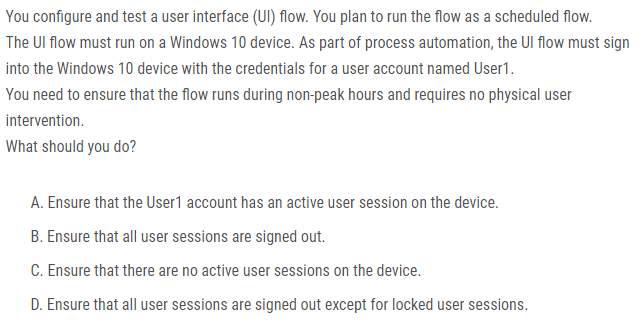
22 (binary/octet-stream)
|
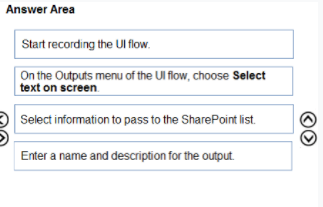
B https://docs.microsoft.com/en-us/power-automate/ui-flows/run-ui-flow |
|
Image:
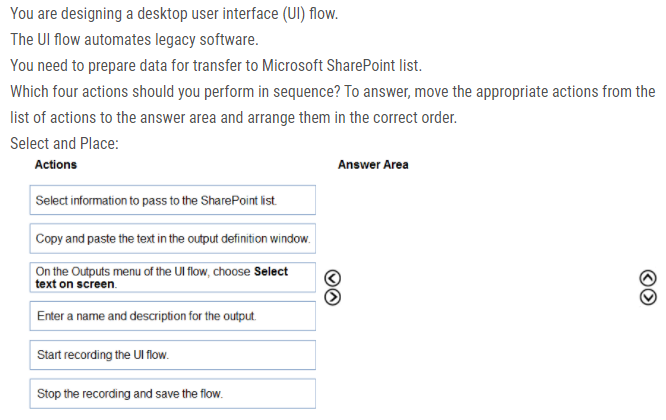
24 (binary/octet-stream)
|
Image:
Sv+1 (binary/octet-stream)
|
|
Image:
25 (binary/octet-stream)
|
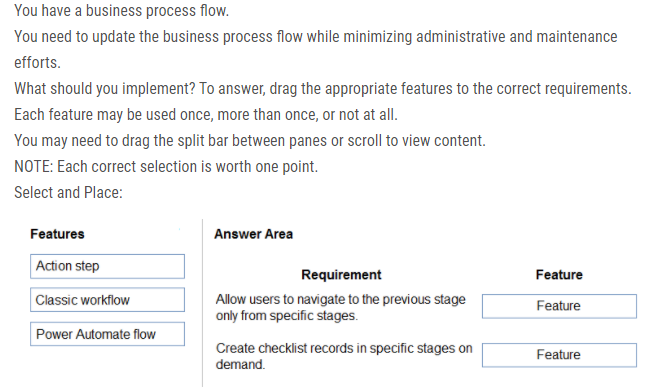
A, A (iaf i kommentarer) |
|
Image:
26 (binary/octet-stream)
|
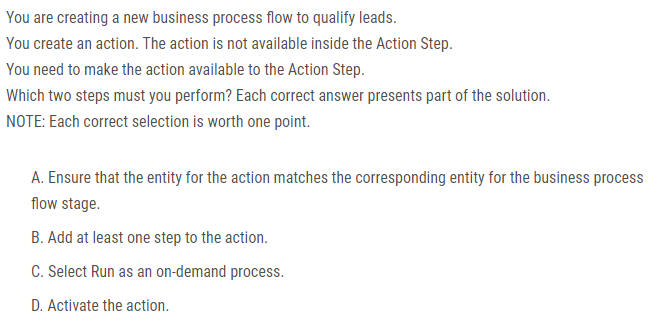
A, D |
Want to create your own Flashcards for free with GoConqr? Learn more.