8068293
Description
Flowchart by Alex Burden, updated more than 1 year ago
|
|
Created by Alex Burden
almost 8 years ago
|
|
Flowchart nodes
- Sample Sizes
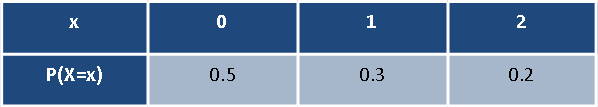
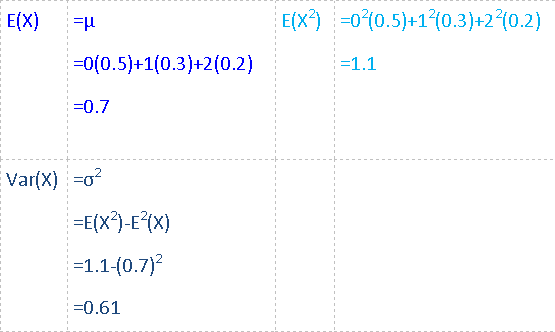
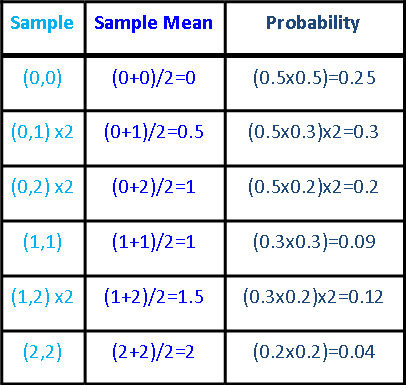
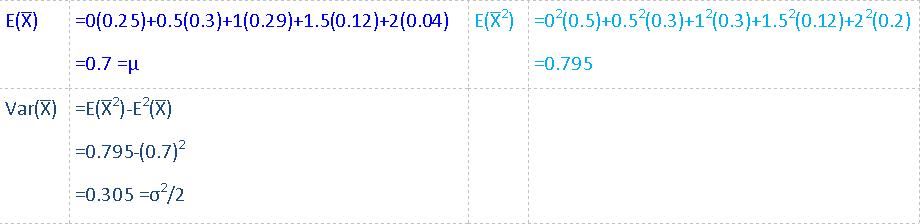
- A sample size of 2 is taken. Consider the mean of all possible samples and confirm E(X̅)=μ and Var(X̅)=σ^2/2
- A tree diagram can be used for a sample size of 2 if easier to calculate.Sample sizes can be more than 2
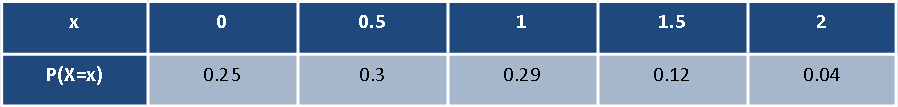
- New Probability table:
Want to create your own Flowcharts for free with GoConqr? Learn more.