7936703
Description
Mind Map by JORGE NUÑEZ, updated more than 1 year ago
|
|
Created by JORGE NUÑEZ
over 7 years ago
|
|
Conceptos de los tipos de Graficos en Excel
- Grafico
- Es la forma de representar datos numericos en
formato grafico para facilitar su comprencion
- Es la forma de representar datos numericos en
formato grafico para facilitar su comprencion
- Tipos de Graficos
- Graficos de columna
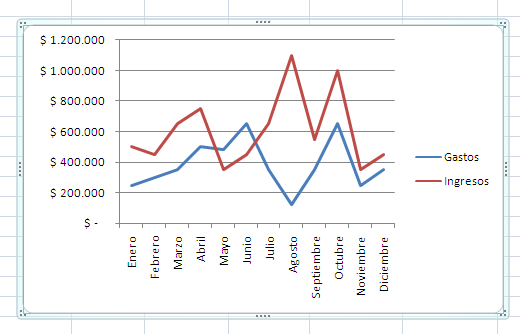
- Graficos de lineas
- Graficos circulares
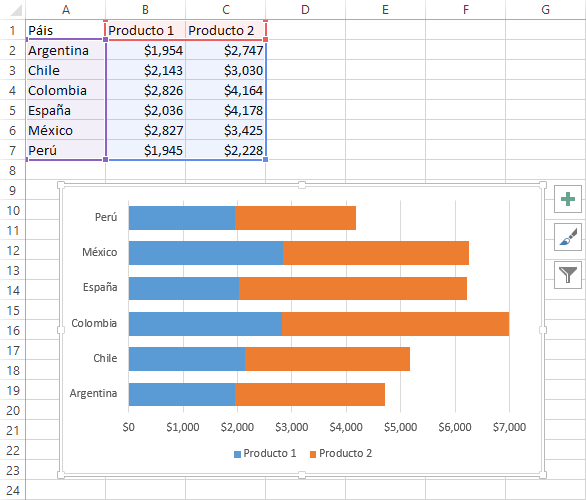
- Graficos de barras
- Graficos de area
- Graficos de tipo XY(Dispersion)
- Graficos de columna
Media attachments
Want to create your own Mind Maps for free with GoConqr? Learn more.