2126870
Description
Mind Map by Georgia Knight, updated more than 1 year ago
|
|
Created by Georgia Knight
almost 10 years ago
|
|
AQA AS Biology: 2.7 Variation
- Interspecific Variation: when one species
differ from another.
- Intraspecific Variation: when members of
the same species differ from each other
- Sampling
- samples should be representative of the
population as a whole
- sampling bias: selection process may be biased due to
unrepresentative choices from the samplers. for example, samples
may only be taken from dry, not muddy areas of a field.
- chance: by pure chance, chosen samples may not be representative.
- minimise the effects of chance by: 1. having a bigger sample size. 2.
analysing data collected, for example spotting anomalies
- minimise the effects of chance by: 1. having a bigger sample size. 2.
analysing data collected, for example spotting anomalies
- sampling bias: selection process may be biased due to
unrepresentative choices from the samplers. for example, samples
may only be taken from dry, not muddy areas of a field.
- Random sampling helps to eliminate bias. One method is to: 1. divide study area into grid
of numbered lines. 2. using a random number generator obtain coordinates. 3. take
samples at intersections of pairs of coordinates.
- samples should be representative of the
population as a whole
- Causes of Variation
- Genetic differences
- due to different genes that each organism posesses
- mutations - sudden changes to genes may be
passed on to the next generation
- meiosis - the type of nuclear division that forms the gametes. this mixes
up genetic material before it is passed into the gametes
- fusion of gametes - in sexual reproduction, offspring inherit
some characteristics of each parent and are therefore
different from both of them
- mutations - sudden changes to genes may be
passed on to the next generation
- due to different genes that each organism posesses
- Environmental influences
- e.g in plants: pH, food avaliability and
climatic conditions can affect plant's
growth etc.
- e.g in plants: pH, food avaliability and
climatic conditions can affect plant's
growth etc.
- Genetic differences
- Types of Variation
- due to genetic factors
- represented on bar charts or pie charts as
characteristics like eye colour are not continuous
- represented on bar charts or pie charts as
characteristics like eye colour are not continuous
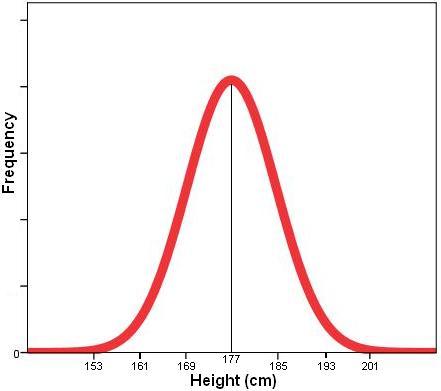
- due to environmental influences
- characteristics such as height and mass - controlled by
polygenes and environmental factors.
- portrayed on normal distribution curves
- characteristics such as height and mass - controlled by
polygenes and environmental factors.
- due to genetic factors
- Mean and Standard
Deviation
- Mean - a measurement at the maximum height of the
curve, provides an average value and useful for comparison
- Standard deviation - a measure of the width of the curve. it gives an
indication of the range of values either side of the mean
- Mean - a measurement at the maximum height of the
curve, provides an average value and useful for comparison
Media attachments
Want to create your own Mind Maps for free with GoConqr? Learn more.