2871503
Description
Mind Map by lilyankee8, updated more than 1 year ago
|
|
Created by lilyankee8
over 10 years ago
|
|
GCSE Statistics
- The Binomial Distrubution
- expansions
- p=1/6 chance if getting a 6.
- q=5/6 chance of being late
- Probability of rolling a 6?
- p(6) = 1/6
- =1/6 x 1/6 x 1/6 = 1/216
- =1/6 x 1/6 x 1/6 = 1/216
- p3 = p x p x p
- q = 5/6
- 3pq2 = 3x1/6 x (5/6)2
- = 25/72
- = 25/72
- 3pq2 = 3x1/6 x (5/6)2
- p(6) = 1/6
- Probability of rolling a 6?
- p= 0.4 chance of being late
- q= 0.6 chance of being late
- (p+q)3 = p2 + 2pq + q2
- (p+q)3 = p3 + 3p2q + 3pq2 + q3
- (p+q)4 = p4 + 4p3q + 6p2q2 + 4pq3 + q4
- (p+q)5 = p5 + p5 + 5p4q + 10p3q2 + 10p2q3 + 5pq4 + q5
- (p+q)5 = p5 + p5 + 5p4q + 10p3q2 + 10p2q3 + 5pq4 + q5
- (p+q)4 = p4 + 4p3q + 6p2q2 + 4pq3 + q4
- (p+q)3 = p3 + 3p2q + 3pq2 + q3
- p=1/6 chance if getting a 6.
- expansions
- Index Numbers
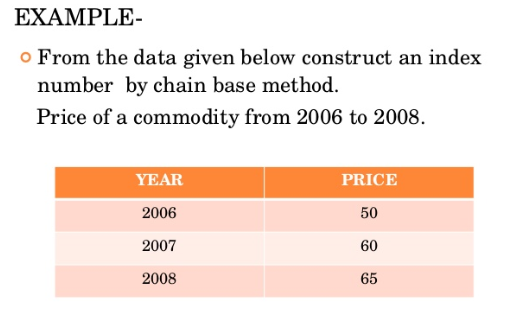
- index number for 2007: 60÷50 x 100 = 120
- Work out the index number for each year using 2006 as the base year:
- Index number for 2008: 65 ÷ 60 x 100 = 108.3 = 108
- Index Number = Current Price÷base year price x 100
- Chain Based Index Number = current price ÷ previous year price x 100
- Weighted index number E (index number x weight) ÷ E weight
- E = Sum
- E = Sum
- Chain Based Index Number = current price ÷ previous year price x 100
- Index Number = Current Price÷base year price x 100
- Work out the index number for each year using 2006 as the base year:
- Simple Index numbers:
- index number for 2007: 60÷50 x 100 = 120
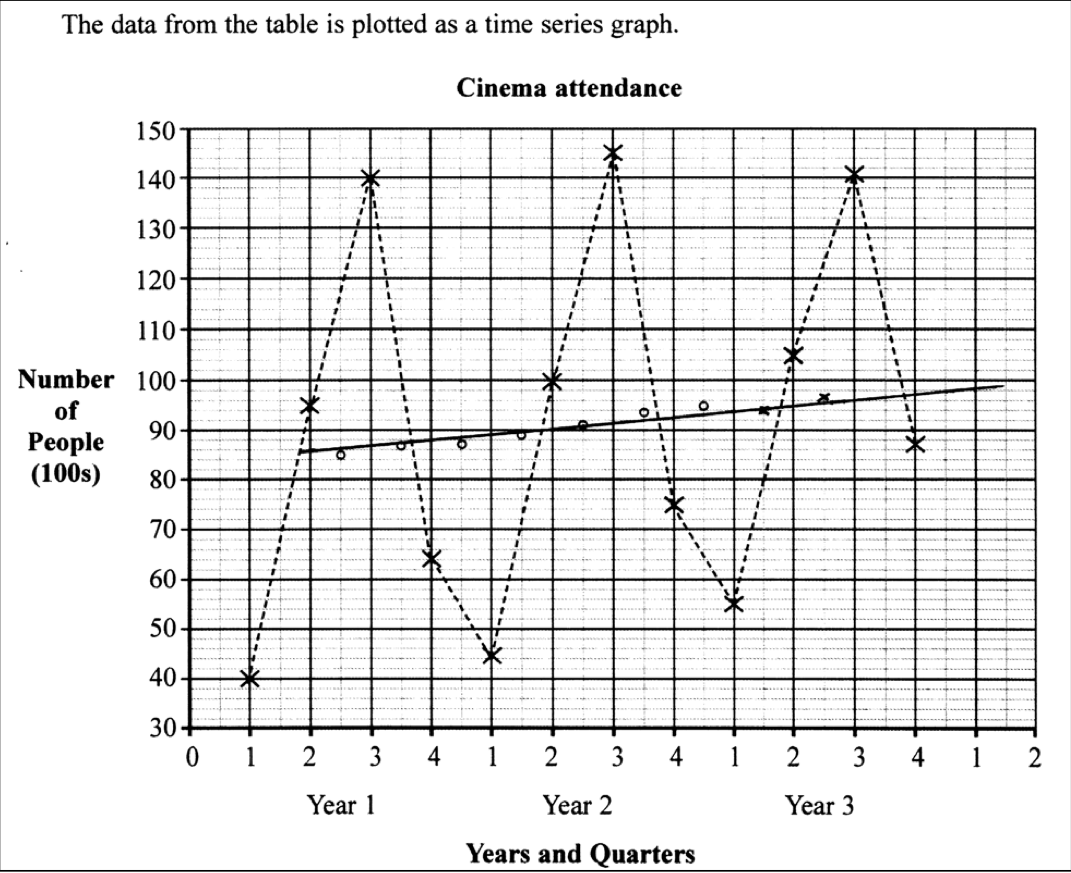
- Time Series
- NOTES:
- Comment on the highest and lowest values and if there is any
patterns
- Calculate the average seasonal variation for quarter 1
- -42 - 44 - 40 ÷ 3 = -42
- -42 - 44 - 40 ÷ 3 = -42
- Calculate the average seasonal variation for quarter 1
- Time is plotted on the horizontals
- Example: The trend line for the
sales of ice cream is rising, yet the
sales in the first and fourth quarter
are less then the trend line suggest ,
while those in the second and third
quearters are above the trend
suggesting a seasonal variation.
More ice cream is sold in the
summer months when weather
conditions are ideal for eating ice
cream.
- Comment on the highest and lowest values and if there is any
patterns
- NOTES:
- Collecting Data
- Random Sample : Where each piece of data has an equal chance of being
picked.
- Stratified Sample: Where the data sampled is in proportion to the population
- Quota Sample: The amount of quota of each group is given eg 100 woman were sampled
- Systematic Sampling- Data is chosen at regular intervals eg every 10th person
- Cluster Sampling: The population is divided into groups (cluster) and then a group is chosen at random
- Pilot survey:pre-test
- suitable for bigger survey
- suitable for bigger survey
- Pilot survey:pre-test
- Census: This is when all of the data in the population is taken. For example a census of the entire population of the UK is taken every 10 years.
- Unbiased
- Time consuming
- Unbiased
- Sample
- Cheaper
- Biased
- Primary Data
- Reliable
- Time consuming
- Secondary Data
- Already been collected for you. Ready to analyse
- Unreliable
- Already been collected for you. Ready to analyse
- Reliable
- Cheaper
- Random Sample : Where each piece of data has an equal chance of being
picked.
- Calculations
- Frequency Distributions
- Means age e.g 408 ÷ 30 = 13.6
- Means age e.g 408 ÷ 30 = 13.6
- Means from grouped data
- Mean height = 1705 ÷ 15 = 113.67
- Mean height = 1705 ÷ 15 = 113.67
- Standard deviation
- Frequency Distributions
Media attachments
Want to create your own Mind Maps for free with GoConqr? Learn more.