Description
|
|
Created by Selam H
over 11 years ago
|
|
|
|
Copied by Jack Nicoletti
over 7 years ago
|
|
Page 1
Solving Inequalities:Solving an inequality is exactly like solving a regular equation except equations have equal signs. For instance, if you solved the 2x + 1 > 9, here are the steps:1. 2x + 1 > 9 (-1) (-1)2. 2x > 8 ÷2 ÷23.Answer: x > 4Switching Signs:When you solve a inequality regularly and get the variable on one side, but the answer is negative, you switch the sign around to the opposite side. For example, if you solved -40n ≤ 10, here are the steps:1. -40n ≤ 10 (÷ -40) (÷ -40)2. n ≤ -¼ (switch)3. Answer: n ≥ -¼*Double Inequalities- an inequality including two signs instead of one.Solving double inequalities are the same the same thing as well except for this time, you would get the variable by itself by adding, subtracting, dividing, or multiplying everything to three parts of the equation instead of two. For instance, if you solved, -2 ≤ 2x-3 ≤ 7, here are the steps:1. -2 ≤ 2x-3 ≤ 7(+3) (+3) (+3)2. 5 ≤ 2x ≤ 10 (÷2) (÷2) (÷2)3. Answer: ½ ≤ x ≤ 5
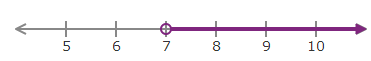
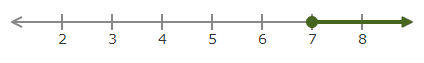
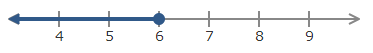
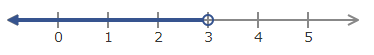
Graphing inequalities with 1 variable:When graphing inequalities, ≥ would be a filled in circle and an arrow pointing to the right. This is because the answer includes the number AND anything greater than it.x ≥ 7In addition, ≤ would be a filled circle and an arrow pointing to the left. This is because the answer includes the number AND anything smaller than x ≤ 6Furthermore, > would be graphed with an empty circle and an arrow pointing to the right. This is because the answer is ONLY anything greater than the number.x > 7Finally, > would be graphed with an empty circle and an arrow pointing to the right. This is because the answer is ONLY anything greater than the number.x > 3
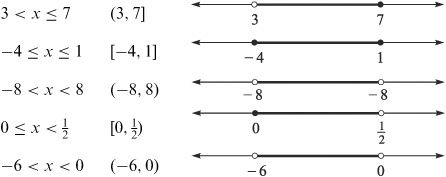
Graphing Double Inequalities:To graph a double inequality, you do the same thing as you do for graphing regular inequalities; the only difference is that now it doesn't go on and on in a positive or negative direction. In addition, to write the answer, you use a bracket → [ for greater than or equal to and less than or equal to. You use a parentheses → ( for less than or greater than. Here are some examples:
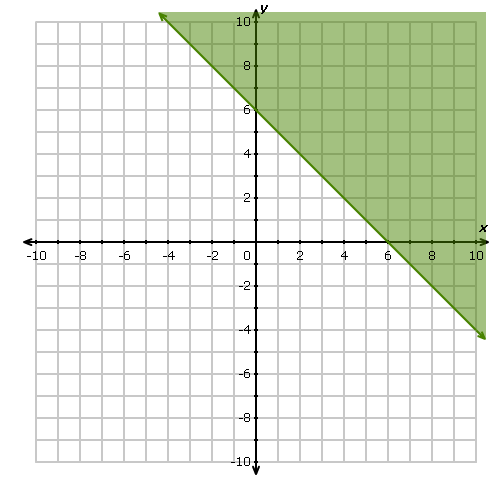
Graphing Inequalities with 2 variables:Steps: Make the y in the slope intercept form equation, y = mx + b on one side and put everything else on the To graph inequalities, we graph them the same way you graph a regular line: slope intercept form y = mx + b. First, plot the y intercept (b) on the y axis. Next, use the slope (m) to plot the second point; if the slope is a whole number, put it over 1, and plot it by doing "rise over run." If the inequality has a less than or greater than sign, this means that the boundary line will be dotted. If the inequality has a less than or equal to or greater than or equal to sign, this means that the boundary line will be solid. Once you have graphed the line, you've already graphed the "or equal to" part (it's just the line without the shading); now you need to shade where the corresponding inequality sign. If the sign is less than or less than or equal to, shade under the line. If the sign is greater than or greater than or equal to, shade under the line.* If you can't remember this, than you can substitute a point in place [ex:(0,0)] the statement is false, so you should shade the region that does not contain (0,0).
Inequality - the relation of two expressions not with a equal sign but with the following signs: greater than or equal to less than or equal to greater than less than
Example 1:x + y ≥ 6 → y ≥ -x + 6
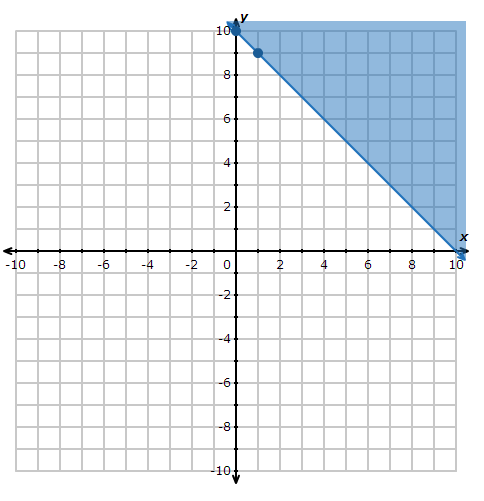
Example 2:y ≥ -x + 10
A similar way for graphing inequalities (with shading) is shown in the following video:
One variable
Two Variables
Want to create your own Notes for free with GoConqr? Learn more.