21105621
Descrição
FlashCards por lizabeth rawson, atualizado more than 1 year ago
|
|
Criado por lizabeth rawson
quase 5 anos atrás
|
|
| Questão | Responda |
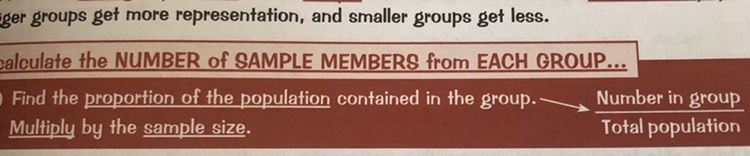
| How do you find the number of samples from each group? | |
| What is mode, median, mean and range | mode = most common median = middle value mean = total of items ÷ number of items range = difference between highest and lowest |
| Quartiles divide data into ___ equal groups the quartiles are __%, 50%, 75% and ___% | 4 25 100 |
| In terms of frequency tables, what is the mode, median, mean and range? | mode = category with the most entries median = category of the middle value mean = fx column ÷ frequency range = the difference of the extremes of the categories |
| how do you find the mid point of categories? | Add together the en values of the class and divide by 2 |
| To find a mean, in group frequency tables you add a third column and enter the ________value of each class. Then add a fourth column to show frequency x _______value of each class | Mid interval Mid interval |
| Give the equation for frequency density? | Frequency ÷ Class Width |
| A strong correlation is when... | The points make a relatively straight line |
| Weak correlation is when... | The points don't line up but still trend and can form a LOBF |
| What is positive/negative correlation? | Positive - Slopes up Negative - Slopes down |
| When does a scatter graph have no correlation? | When you cannot draw a LOBF |
| Give the formula of probability | Number of ways for something to happen __________________________________________ Total number of possible results |
| Formula for expected frequency | Expected Times Outcome will happen = Probability x number of trails |
| Give the AND rule | P(A and B) = P(A) x P(B) |
| Give the OR rule | P(A or B) = P(A) + P(B) |
| Give the formula for relative frequency | Frequency ______________________ Number of trails |
| big PP? | or big PP energy? (U have the small pp) |
| In a histogram graph, what does the area of a bar represent? | Frequency |
Quer criar seus próprios Flashcards gratuitos com GoConqr? Saiba mais.