449612
Descrição
Notas por rory.examtime, atualizado more than 1 year ago
|
|
Criado por rory.examtime
aproximadamente 11 anos atrás
|
|
Página 1
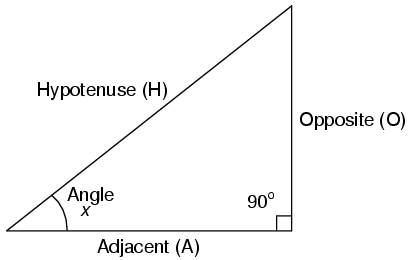
In a right-angled triangle, the sine of an angle is the ratio of the length of the side opposite the angle to the length of the hypotenuse.
Sin(X) = O H
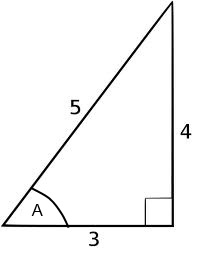
For example, in this triangle:
the sine of angle A (SinA) is 0.8, because the ratio of the opposite side (4) to the hypotenuse (5) is 4/5.
Graph of sin(x):
- Note that x is in radians, not degrees.
- This graph is often referred to as a wave, and has a period of 2π (after every 2π radians, the graph repeats it self)
- The graph has a max-value of y=1 and a min-value of y=-1. This is because the hypotenuse is always the longest side in a right-angled triangle.
New Page
Quer criar suas próprias Notas gratuitas com a GoConqr? Saiba mais.