3097128
Beschreibung

Quiz von Hans Novelus, aktualisiert more than 1 year ago
|
|
Erstellt von Hans Novelus
vor mehr als 9 Jahre
|
|
Frage 1
Frage
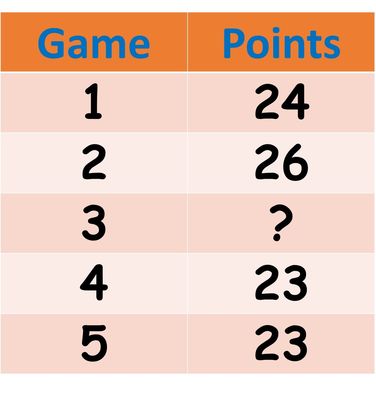
Reggie Miller's points were recorded over the first 5 games of the season. Find the missing item if his mean score is 22.
Antworten
-
14
-
23
-
24
-
15
Frage 2
Frage
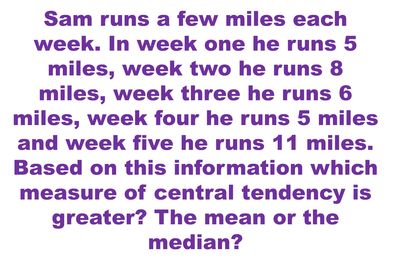
Which measure of central tendency has a greater value the mean or the median?
Antworten
-
mean
-
median
-
same value
Frage 3
Frage
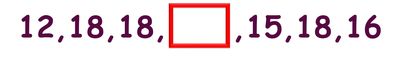
Which answer below represents the missing item if the mean is 16?
Antworten
-
18
-
17
-
15
-
6
Frage 4
Frage
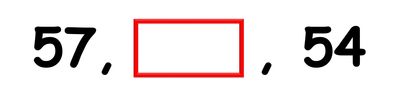
What item would have to be in the box if the mean is 58? Once you find it locate the RANGE below.
Antworten
-
70
-
16
-
63
-
9
Frage 5
Frage
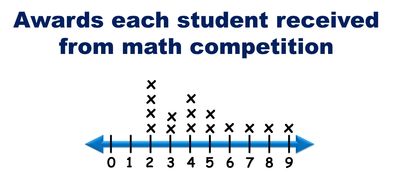
Two classes at M.S. 224 attended a math competition in which they went home with awards. The line plot shows how many awards each student left with. How much more is the mean than the median?
Antworten
-
1.5
-
0.4
-
7
-
4.4
Frage 6
Frage
From these set of items, Which answer choice shows the median, mode and mean in order from least to greatest?
Antworten
-
median, mode , mean
-
mean, median , mode
-
mode, median, mean
-
They are all equal in value
Frage 7
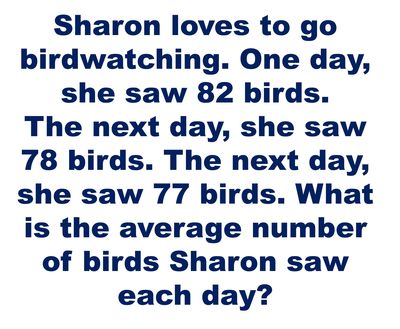
Antworten
-
234
-
78
-
79
-
5
Frage 8
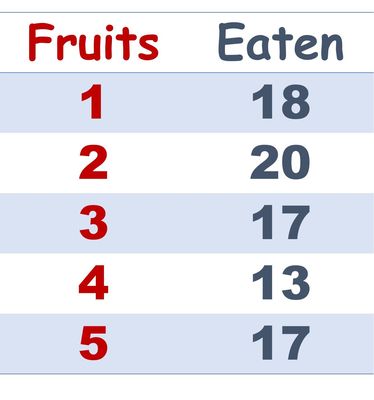
Frage
This chart represents the amount of fruits eaten over a 5 day period. Which answer choice below shows the sum of the mean and the range?
Antworten
-
34
-
3
-
22
-
24
Möchten Sie mit GoConqr kostenlos Ihre eigenen Quiz erstellen? eigenen Mehr erfahren.