22651012
Descripción
Fichas por Minal Shah, actualizado hace más de 1 año
|
|
Creado por Minal Shah
hace más de 4 años
|
|
| Pregunta | Respuesta |
| Mean | Average. Find the mean by adding together all the numbers then dividing by the number of terms. Ex: To find the average of 6, 9, and 21 first add them together: 6 + 9 + 21 = 36. Then divide by 3 since we started with 3 numbers: 36/3 = 12. The mean is 12. |
| Median | The median is the middle number when the numbers are in order from least to greatest. Ex: For the numbers 4, 7, 3, 9, 0 first we put them in order: 0, 3, 4, 7, 9. The median is 4 since 4 is in the middle |
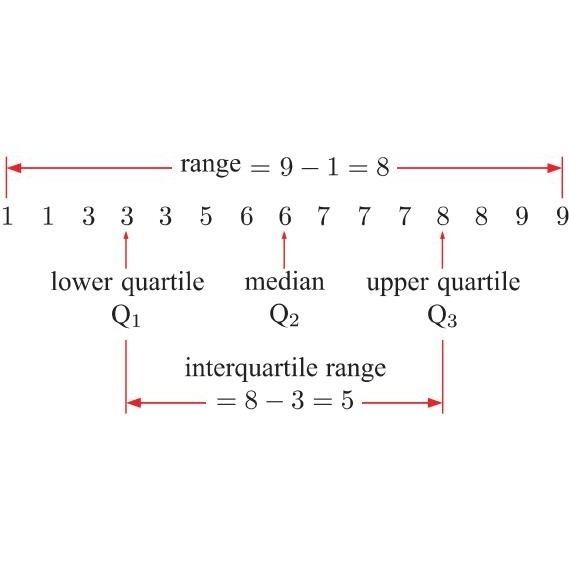
| Interquartile Range | After finding the median, find the middle numbers of the bottom half and top half of numbers and find their difference. |
| Mode | The mode is the number that shows up the most often in a group of numbers. Ex: In the data set 6, 9, 2, 3, 2, 8, 9, 2, the mode is 2 since 2 is the most common number in the set. It is possible to have more than one mode. |
| Range | The range is the largest number in a set minus the smallest number. Ex: In the data set 5, 2, 9, 7, 3, 4, 6 the largest number is 9 and the smallest number is 2. The range is 9 - 2 = 7. |
¿Quieres crear tus propias Fichas gratiscon GoConqr? Más información.