
8256286
Description
Flowchart by Sinead Cunningham, updated more than 1 year ago

|
|
Created by Sinead Cunningham
almost 8 years ago
|
|
Flowchart nodes
- Current population 4.7 millionunevenly distributed
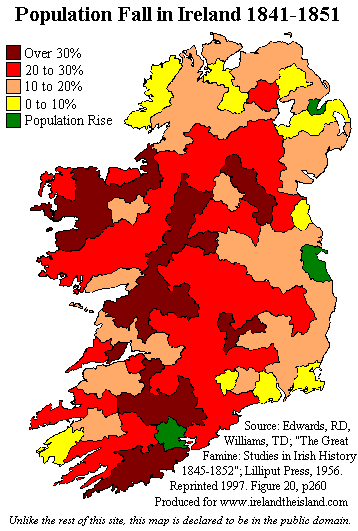
- Prior to Famine: Over 6 millionRural Areas: High Population Densities
- 1845-1848 The Great FamineDeath and High Levels of EmigrationDramatic reduction of population densities in rural areas.
- Early 20th CenturyInternal MigrationRural to Core Regions e.g. DublinKey Stat: between 1926 and 2002 Dublin 122% increase in population, Mayo 23% decrease
- Rural DepopulationRural to Urban (West to East)Employment, Access to Services, Better way of life.
- 1970s Counter UrbanisationSmaller Urban Areas (Athlone and Mullingar)Space and low density of housingImproved infrastructure improved development
- UrbanisationCork, Limerick, Galway increased populationsDublin grew even strongerGrowth of Leinster and urbanisation (2nd half of 20th Century) dominated population distribution.
- Population Densities:67 ppl per square km
0 comments
Want to create your own Flowcharts for free with GoConqr? Learn more.