17194809
Descrição
FlashCards por Nimbe Gallegos, atualizado more than 1 year ago
|
|
Criado por Nimbe Gallegos
quase 6 anos atrás
|
|
| Questão | Responda |
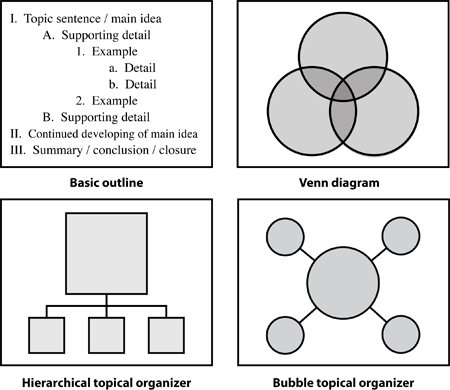
| Graphic Organizers | They help you make connections and structure thinking, you can turn to graphic organizers for writing projects. |
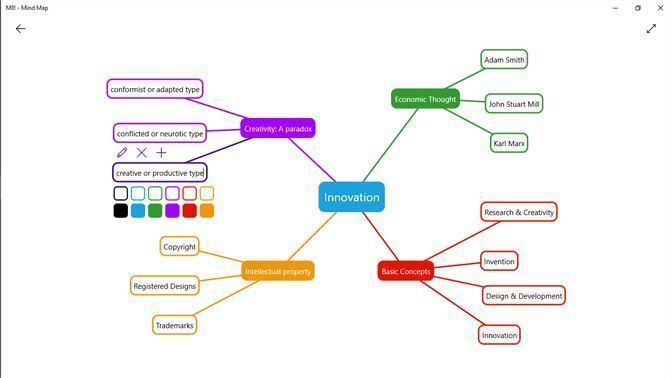
| Mind Maps | They’re a visual form of note taking that offers an overview of a topic and its complex information, allowing you to comprehend, create new ideas and build connections. |
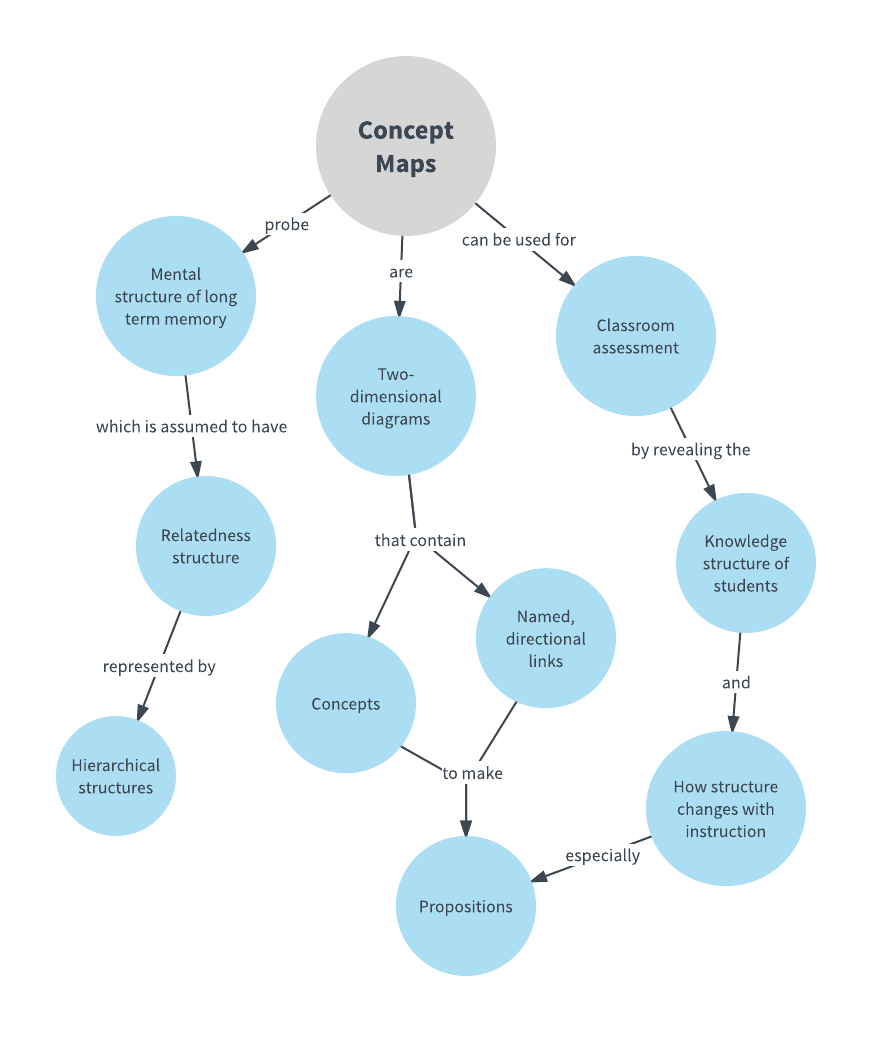
| Concept Mapping | Often represented in circles or boxes, concepts are linked by words and phrases that explain the connection between the ideas. |
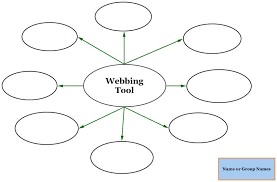
| Webbing | It is a brainstorming method that provides structure for ideas and facts. Typically, major topics or central concepts are at the center of a brainstorming web. Links from the center connect supporting details or ideas with the core concept or topic. |
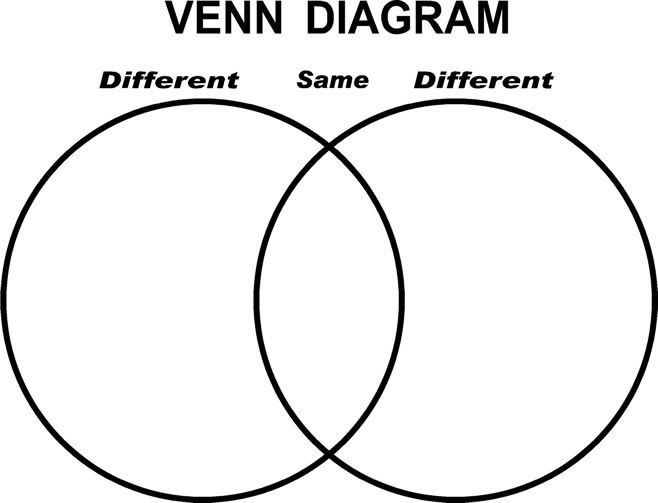
| Venn Diagram | A diagram that uses overlapping circles or other shapes to illustrate the logical relationships between two or more sets of items. Often, they serve to graphically organize things, highlighting how the items are similar and different. |
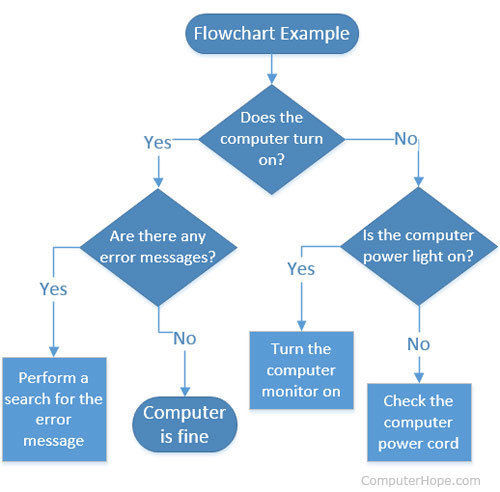
| Flowchart | A diagram that depicts a process, system or computer algorithm. They are widely used in multiple fields to document, study, plan, improve and communicate often complex processes in clear, easy-to-understand diagrams. |
Quer criar seus próprios Flashcards gratuitos com GoConqr? Saiba mais.