16719296
Descripción
Fichas por Eric Pereira, actualizado hace más de 1 año
|
|
Creado por Eric Pereira
hace casi 6 años
|
|
| Pregunta | Respuesta |
| Chartjunk | all visual elements in charts and graphs that are not necessary to comprehend the information eg: heavy grid lines, axes lines,ticks,dsplay frames, pics. Coined by Edward Tufte in 1983 |
| Data Ink | Data-ink is the non-erasable core of a graphic. Coined by Edward Tufte in 1983 in his book "The Visual Display of Quantitative Data" |
| RGB Color Model | How three primary colors (Red Blue Green) can be combined in proportion to give any secondary color. |
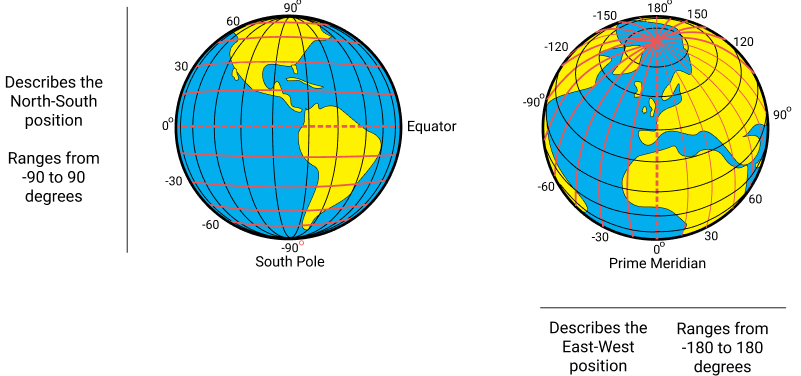
| Latitudes/Longitudes |
¿Quieres crear tus propias Fichas gratiscon GoConqr? Más información.