
6825145
Description
Question 1
Question
Charting allows investors to use technical analysis to make decisions regarding investments.
Answer
- True
- False
Question 2
Question
When trading options charting tells us:
Answer
-
How a stock has reacted in the past
-
Present status or trends
-
What the stock has forecasted to do in the future
-
Which stock is guaranteed to make the highest cash flow.
Question 3
Question
Check the type of indicators that we should most often
Answer
-
Greeks
-
Volume
-
MACD's
-
Coval
Question 4
Question
Volume is how much a stock is [blank_start]traded[blank_end] on a given day.
Answer
-
traded
Question 5
Question
Volume represents the 25 day average volume level.
Answer
- True
- False
Question 6
Question
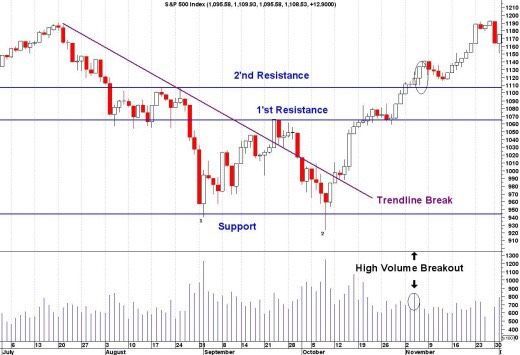
Anytime the volume is above the horizontal line it shows.
Answer
-
Shows a decrease in buying and selling
-
Institutions have stopped trading
-
The stock market is sideways
-
Increased buying and selling
Question 7
Question
Volume spikes are only necessary if you want the stock to [blank_start]change directions[blank_end].
Answer
-
change directions
Question 8
Question
If a stock is sideways what volume indicator shout you look for to predict the stock is about to break through resistance and continue to move up:
Answer
-
Volume should drop
-
Volume should spike
-
Volume should be stationary
-
Volume is irrelevant
Question 9
Question
All bullish patterns can be inverted to create bearish patterns.
Answer
- True
- False
Question 10
Question
A Trading pattern is:
Answer
-
Various lines that crossed paths on a chart.
-
Trading levels drawn separately to create a picture
-
A collection is trading levels drawn together to make it stand out
-
Bars that show volume spikes on a daily basis
Question 11
Answer
-
double bottom
-
double tops
-
ascending triangle
-
head and shoulders
Question 12
Question
What trading pattern is show below:
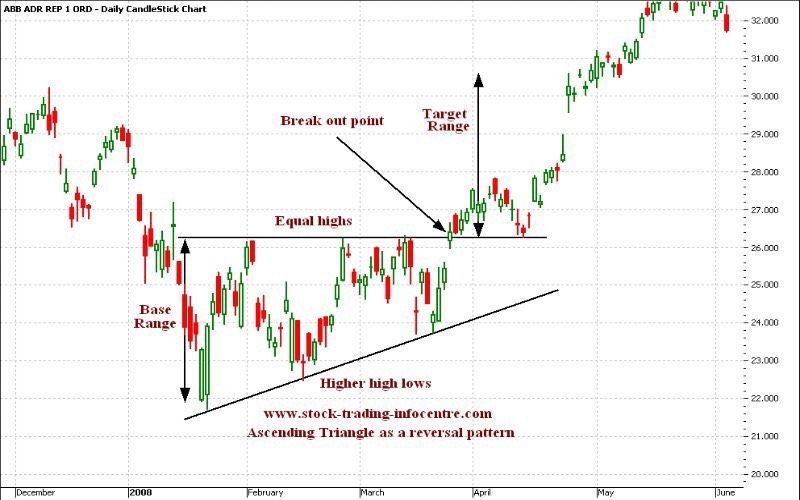
Answer
-
descending triangle
-
ascending triangle
-
double tops
-
triangle
0 comments
Want to create your own Quizzes for free with GoConqr? Learn more.